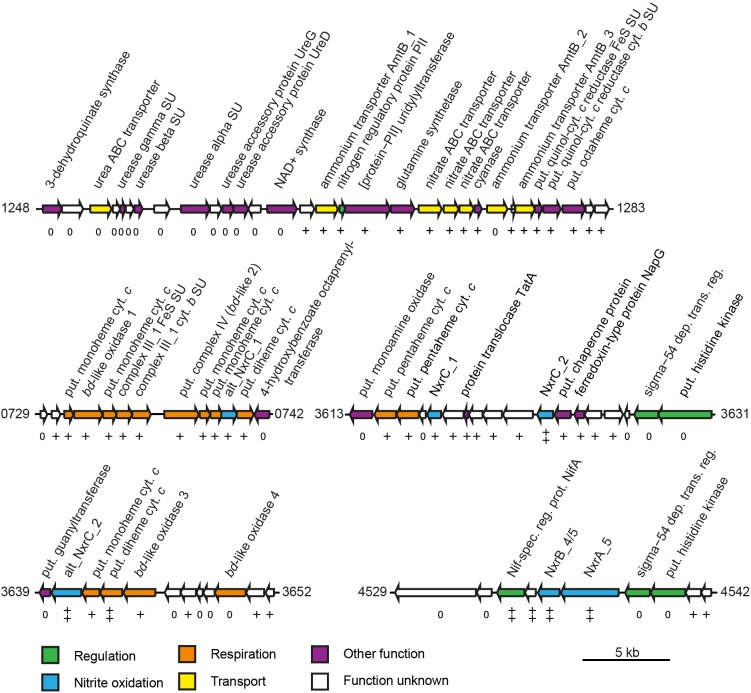
FIGURE 4.
Schematic structure of selected highly expressed regions of the N. moscoviensis genome. Arrows represent gene length and orientation; the MicroScope gene identifier is given for the first and last gene of each region. The nxrAB 4/5 region is shown excluding the deletion described in this study (see Supplementary Figure S1). Gene transcription classes are based on log2-fold to median expression levels; all genes shown are within the top three pentiles (++, first pentile; +, second pentile; 0, third pentile). Cyt., cytochrome; dep. trans. reg., dependent transcriptional regulator; put., putative; spec. reg. prot., specific regulatory protein; and SU, subunit. For further details, please refer to Supplementary Table S1.

