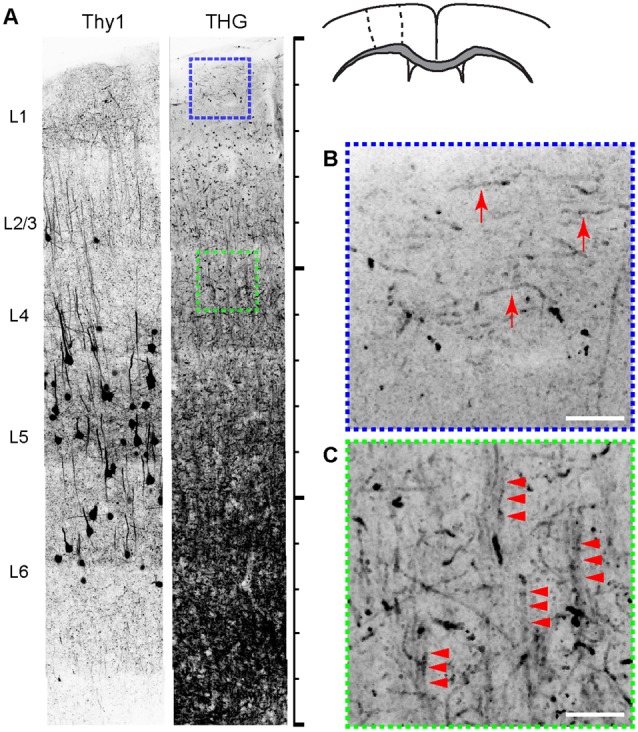
Figure 2.

The relationship between cyto- and myeloarchitecture of the cerebral cortex by Thy1-YFP and THG, respectively (inverted contrasts). (A) The coronal section. Scale bar, 1,500 μm. (B,C) Magnified views of regions shown in (A). THG images of layers 1 (blue) and 4 (green). Myelinated fibers tangential (arrows) and radial to the pia (arrowheads) appear in specific layers. Scale bar, 25 μm.
