
Figure 4.
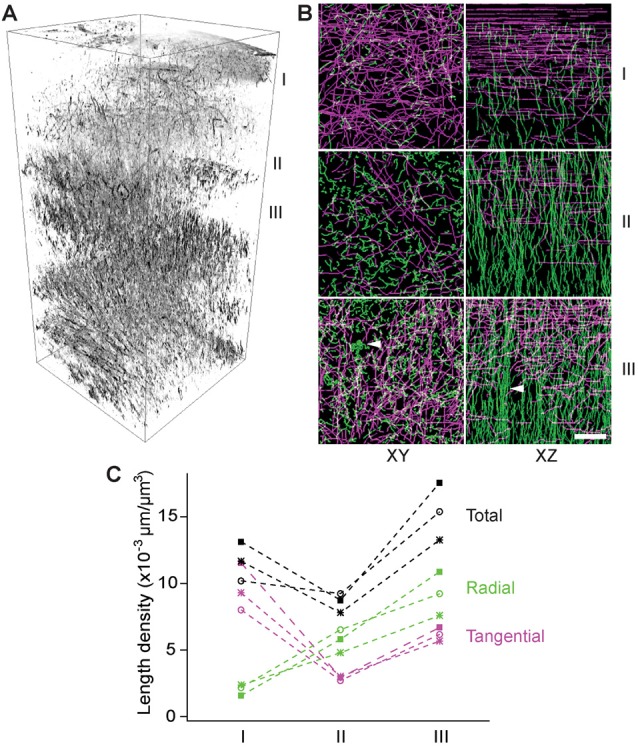
The depth-dependent distribution of tangential and radial fibers. (A) Volumetric rendering of THG stacks in the range of 0–800 μm of the cortex. I, II, and III: 0–100 μm, 200–300 μm, and 300–400 μm below the dura, respectively (inverted contrasts). (B) The transverse (XY) and axial (XZ) projections of traced THG-positive axons exhibiting a lattice structure and fiber bundles (arrowheads) in deeper layers. Scale bar, 20 μm. (C) The length density of traced THG-positive fibers (N = 3).