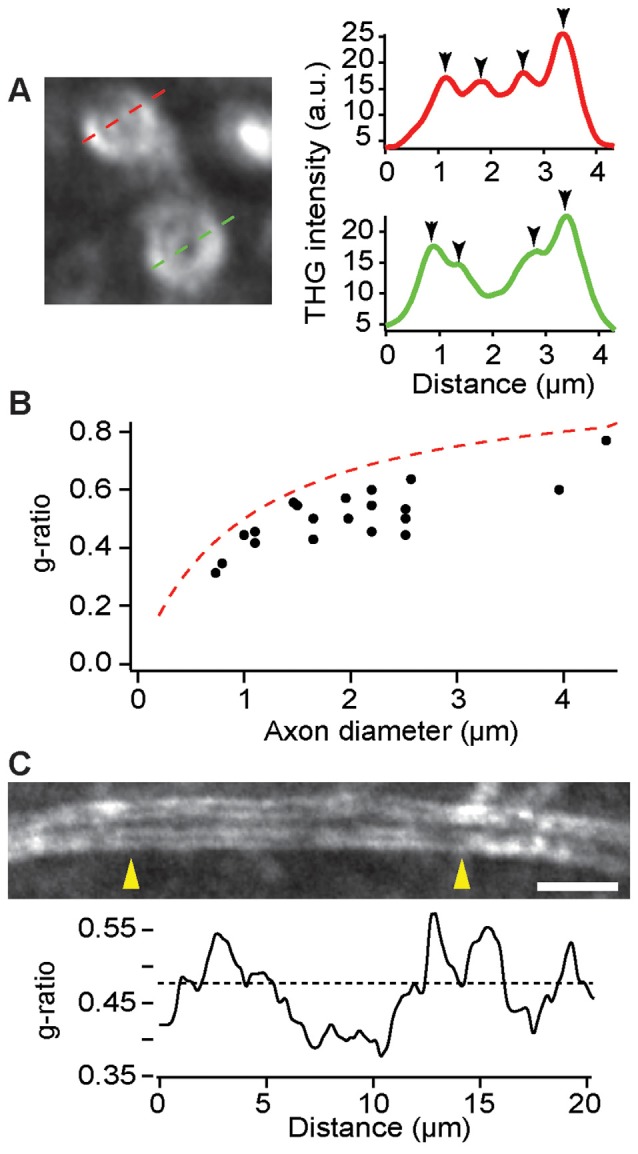
Figure 5.

Evaluation of the g-ratio in the deeper cortex by THG. (A) The cross sections of myelinated axons (left) and the corresponding intensity profiles (right). The position of adaxonal and abaxonal membranes can be precisely determined (arrowheads, right). (B) The g-ratio vs. the axon diameter for a total of 20 axons in layer 6 of the primary motor cortex (M1) of C57BL/6 mice (N = 5). The dashed line is for the case of a 0.5-μm myelin sheath. (C) A single internode at a depth of approximately 500 μm exhibiting variations of the g-ratio across the length between arrowheads (yellow). The dashed line denotes the average g-ratio. Scale bar, 5 μm.
