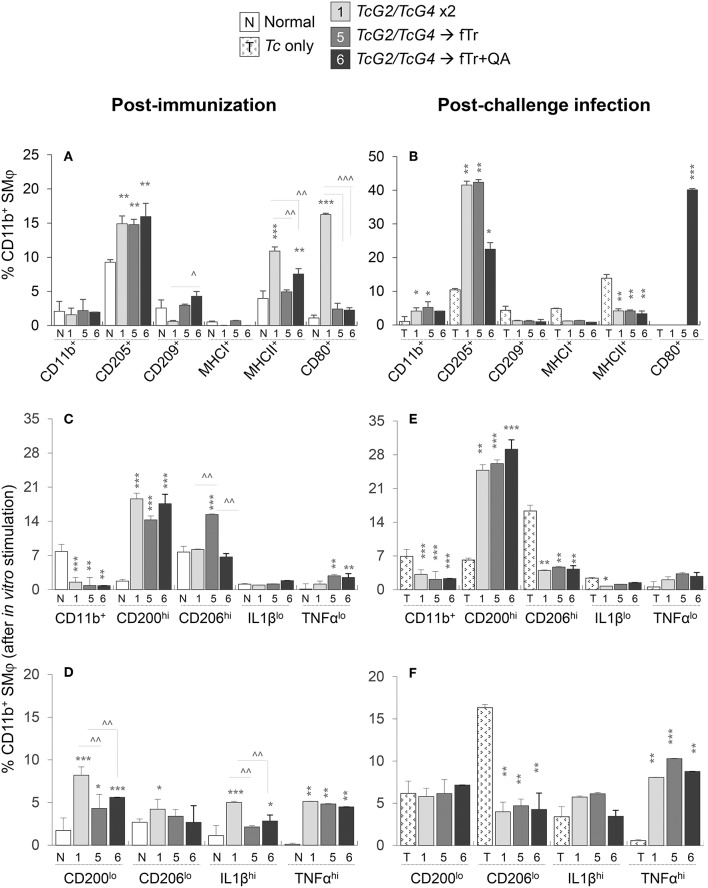
Figure 4.
Antigen presenting capacity and functional profile of splenic macrophages (Mφ) in vaccinated mice (± T. cruzi). Mice were vaccinated and challenged with T. cruzi trypomastigotes as in Figures 1, 2. (A,B) Splenocytes were labeled with fluorochrome-conjugated antibodies and analyzed by flow cytometry. Bar graphs show ex vivo percentages of the splenic Ly6GloCD11b+ Mφ that exhibited surface expression of markers of maturation, antigen uptake, and antigen presentation (CD205+, CD209+, MHCI+, MHCII+, CD80+) in vaccinated (A) and vaccinated/infected (B) mice. (C–F) Splenic cells from vaccinated (C,D) and vaccinated/infected (E,F) mice were in vitro stimulated for 48 h in the presence of soluble T. cruzi lysate (TcL), and then labeled with fluorochrome-conjugated antibodies. Shown are the mean percentages of CD11b+ Mφ that responded to TcL stimulation with expression of markers of classical/proinflammatory (IL-1βhi, TNF-αhi) and alternative/immunomodulatory (CD200hi, CD206hi) phenotype. Splenic cells from non-vaccinated/non-infected and non-vaccinated/infected mice were used as controls. Data (mean ± SD) are representative of two independent experiments (n = 3 mice per group per experiment, duplicate observations per mouse), and significance is annotated as *none vs. vaccinated or infected vs. vaccinated/infected, and ∧comparison of vaccinated groups (*,∧p < 0.05, **,∧∧p < 0.01, and ***,∧∧∧p < 0.001).

