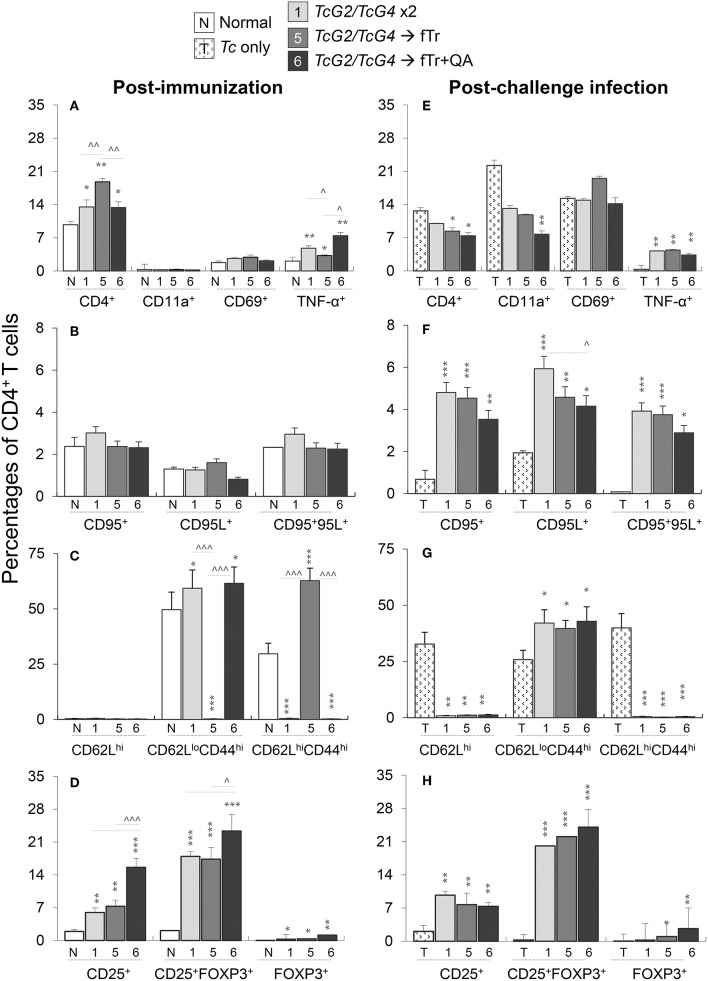
Figure 5.
CD4+T cell functional profile in vaccinated mice (± T. cruzi). Mice were vaccinated and challenged with T. cruzi trypomastigotes as in Figures 1, 2. Splenocytes from vaccinated (A–D) and vaccinated/infected (E–H) mice were in vitro stimulated for 48 h in the presence of soluble T. cruzi lysate, labeled with fluorochrome-conjugated antibodies, and analyzed by flow cytometry. Shown are the percentages of PE+CD4+ splenic T cells exhibiting the expression of markers of (A,E) recruitment (CD11a+, CD69+) and activation (TNF-α+); (B,F) cell death (CD95+, CD95L+); (C,G) effector/memory phenotype (CD62L+, CD44+); and (D,H) T regulatory phenotype (CD25+ ± FoxP3+). Data (mean ± SD) are representative of two independent experiments (n = 3 mice per group per experiment, duplicate observations per sample), and significance is annotated as *none vs. vaccinated or infected vs vaccinated/infected, and ∧comparison of vaccinated groups (*,∧p < 0.05, **,∧∧p < 0.01, and ***,∧∧∧p < 0.001).

