FIGURE 3.
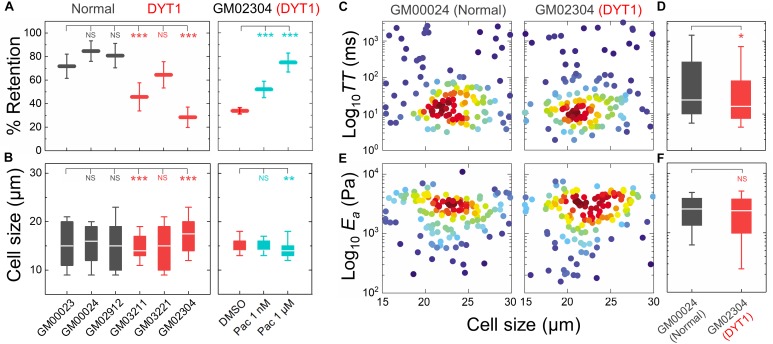
DYT1 dystonia patient-derived fibroblasts have increased deformability compared to controls. (A) PMF measurements of normal and DYT1 dystonia patient-derived fibroblast lines. Paclitaxel (Pac) treatment for 24 h prior to filtration. PMF conditions: 10 μm pore membrane, 1.4 kPa for 50 s. Each data point represents the mean ± SD. Statistical significance was determined using Student’s t-test. (B) Cell size data. Boxplots show 25 and 75th percentiles; line shows median; whiskers denote 10 and 90th percentiles. (C,E) Density scatter plots for TT and Ea measurements determined by q-DC. Each dot represents a single cell. N > 190 per sample. (D,F) TT and Ea measurement boxplots show 25 and 75th percentiles; line shows median; whiskers denote 10 and 90th percentiles. Statistical significance was determined using Student’s t-test. All data were obtained from three independent experiments. ∗∗∗p < 0.001; ∗∗p < 0.01; ∗p < 0.05; and not significant (NS) p > 0.05.

