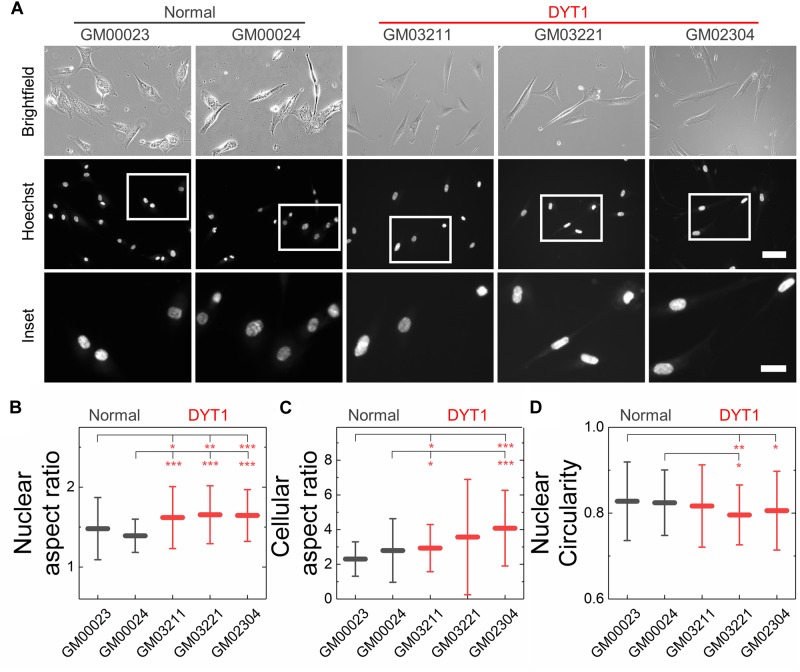
FIGURE 4.
DYT1 dystonia patient-derived fibroblasts and nuclei are slightly more elongated relative to controls but do not exhibit marked differences in shape. (A) Representative brightfield and epifluorescence images of normal and DYT1 dystonia patient-derived fibroblasts and their nuclei. Nuclei were labeled with the fluorescent DNA dye, Hoeschst 33342. Scale, 20 μm. Inset: scale, 10 μm. Quantification of (B) nuclear aspect ratio, (C) cellular aspect ratio, and (D) nuclear circularity. Each data point represents the mean ± SD. Data were obtained from N > 30 cells across three independent experiments. Statistical significance was determined using the Welch’s t-test. ∗∗∗p < 0.001; ∗∗p < 0.01; ∗p < 0.05; and not significant (NS) p > 0.05 is not indicated on these plots for clarity.

