FIGURE 5.
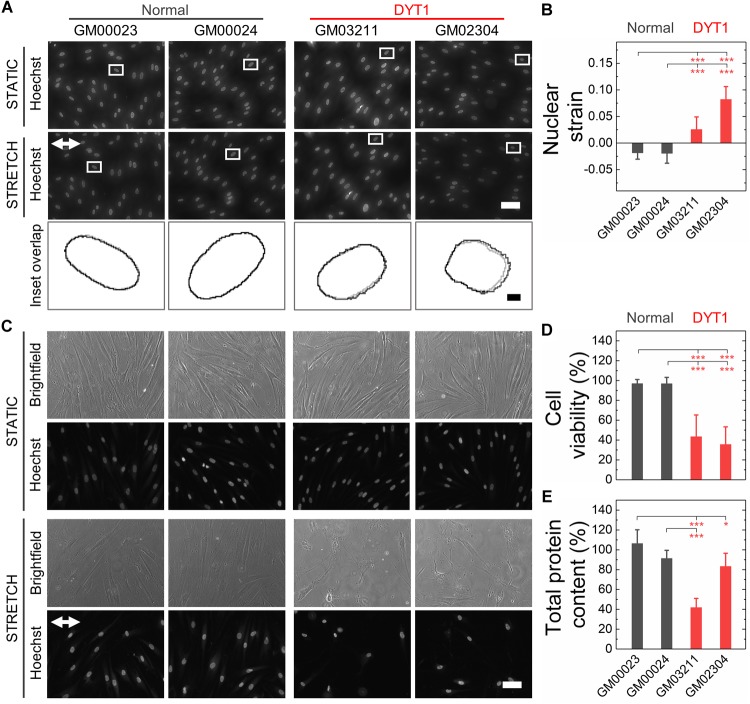
DYT1 dystonia patient-derived fibroblasts exhibit increased nuclear strain and are more susceptible to damage than controls upon mechanical stretch. (A) Representative images of normal and DYT1 dystonia patient-derived fibroblasts stained with Hoechst 33342. Nuclear morphology was examined after cells were exposed to mechanical stretch (5% strain) for 5 min. Images show cells under stretched (Stretch) or non-stretched (Static) conditions. White arrows denotes the direction of uniaxial stretch. Scale, 20 μm. The magnified inset shows overlapping outlines of nuclei from static (gray) and stretched (black) cells. Inset: scale, 1 μm. (B) Quantification of nuclear strain (change in nuclear area) due to cell stretching N > 15 cells. Statistical significance was determined using the Welch’s t-test. (C) Representative images of normal and DYT1 dystonia patient-derived fibroblasts after exposure to 24 h cyclical stretch (5% strain) and static conditions. Cells were stained with Hoechst 33342 to visualize nuclei by epifluorescence microscopy. Scale, 20 μm. (D) Cell viability of normal and DYT1 dystonia patient-derived fibroblasts after exposure to stretch for 24 h and static conditions. The viability data for stretched cells is normalized to static conditions for each cell line. N > 500 cells. (E) Quantification of the total protein content measured from biochemical lysates from cells that were adhered to the PDMS membranes after being exposed to cyclic stretch for 24 h. Total protein content of stretched cells was normalized to the total protein content of cells under static conditions for each cell line. Each data point represents the mean ± SD. Data were obtained from two independent experiments. Scale, 20 μm. Statistical significance was determined using Student’s t-test. ∗∗∗p < 0.001; ∗p < 0.05; and NS p > 0.05 is not indicated on these plots for clarity.

