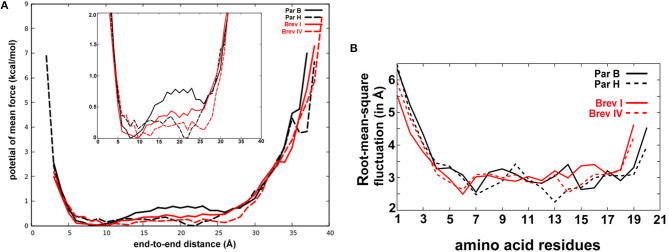
Figure 4.
(A) The reweighted potential of mean force (PMF in kcal mol−1) values calculated for end-to-end distance (in Å). The 20-residue paracelsins have been plotted in black, whereas 19-residue brevicelsins are shown in red. The zoomed version of the plot is provided in the inset. The end-to-end values where PMF is zero or close to zero are the energetically stable values and define the most favorable linear conformation. (B) The root-mean-square deviation (in Å) calculated for each residue for all sequences gives an idea of the average fluctuation undergone by the system. Par, Paracelsin; Brev, Brevicelsin.

