Figure 3.
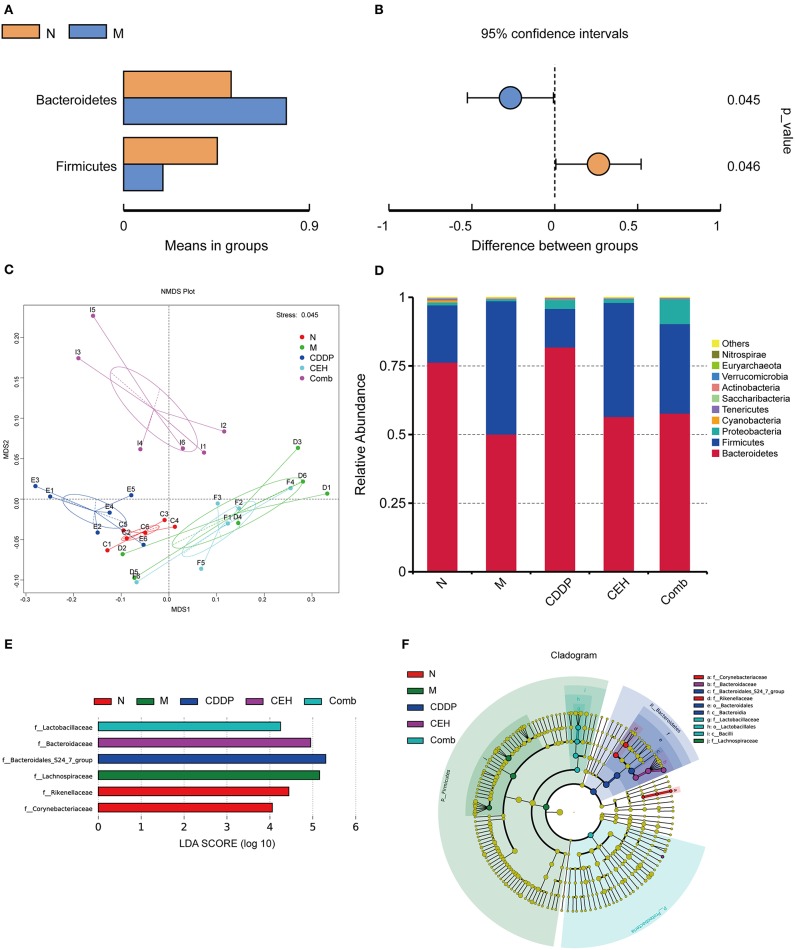
Taxonomic shifts in the microbes. T-test of species difference at the phylum level between N and M; (A) Species abundance display, mean relative abundance of Phylum which with significant difference within the group; (B) Difference confidence display, the difference value of the mean of relative abundance. (C) NMDS plots based on weighted UniFrac distance matrices depicting data based on 16S rRNA gene sequencing. (D) Top 10 species at the phylum level relative abundance histogram. LEfSe (LDA Effect Size) analysis of species with significant differences among different chemotherapy strategy groups. (E) Histogram of the LDA scores at the Family level (the default setting is 4). (F) Cladogram. N, negative control; M, model control; CDDP, CDDP chemotherapy; CEH, cepharanthine hydrochloride chemotherapy; Comb, combined chemotherapy strategy.

