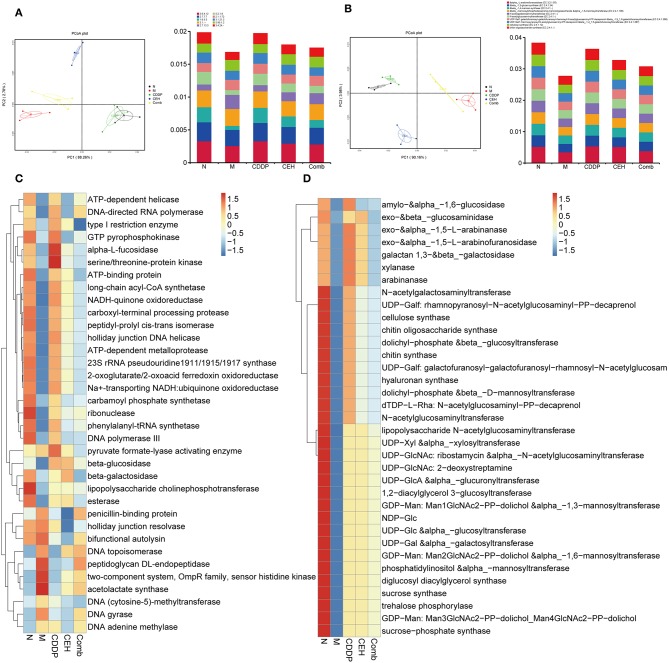
Figure 5.
Different chemotherapy strategies caused changes in the function of the intestinal microbes. (A) PCoA analysis based on KEGG EC (enzyme) abundance (left panel) and top 10 abundance histogram (right panel). (B) PCoA analysis based on CAZy EC abundance (left panel) and top 10 abundance histogram (right panel). (C) KEGG EC top 35 abundance clustering heat map. (D) CAZy EC top 35 abundance clustering heat map. N, negative control; M, model control; CDDP, CDDP chemotherapy; CEH, cepharanthine hydrochloride chemotherapy; Comb, combined chemotherapy strategy.

