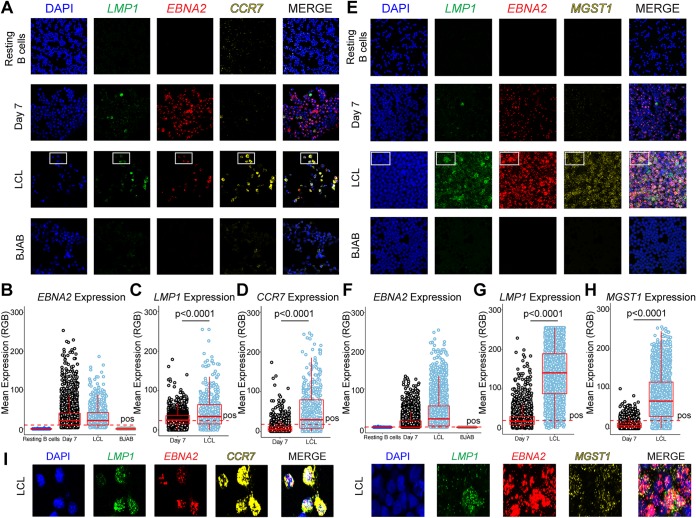
FIG 6.
Multiplex RNA-FISH to distinguish EBV latency states. (A) Confocal immunofluorescence images from resting B cells, 7 dpi EBV+ latency IIb proliferating B cells, LCLs, and BJAB cells stained with LMP1, EBNA2, and CCR7 RNA FISH probes. (B) Quantification of the EBNA2 expression data presented in panel A. RGB, red green blue. (C) Quantification of data representing LMP1 expression in EBNA2+ cells presented in panel A. (D) Quantification of data representing CCR7 expression in EBNA2+ cells presented in panel A. (E) Analyses were performed as described for panel A but for LMP1, EBNA2, and MGST1 mRNA. (F) Quantification of EBNA2 expression data presented in panel E. (G) Quantification of data representing LMP1 expression in EBNA2+ cells presented in panel E. (H) Quantification of data representing MGST1 expression in EBNA2+ cells presented in panel E. (I) Magnification of boxed region in LCLs shown in panels A and E for EBNA2, LMP1, and CCR7 or MGST1 expression. For all quantifications, data representing day 7 cells and LCLs are averages of results from 3 independent donors and 7 fields of view per donor. For resting B cells, the data are representative of one blood donor and 7 fields of view. BJAB data also represent averages from analyses of 7 fields of view. *, P < 0.05; **, P < 0.01; ***, P < 0.001 (by one-tailed Mann-Whitney nonparametric t test). All error bars denote SEM.

