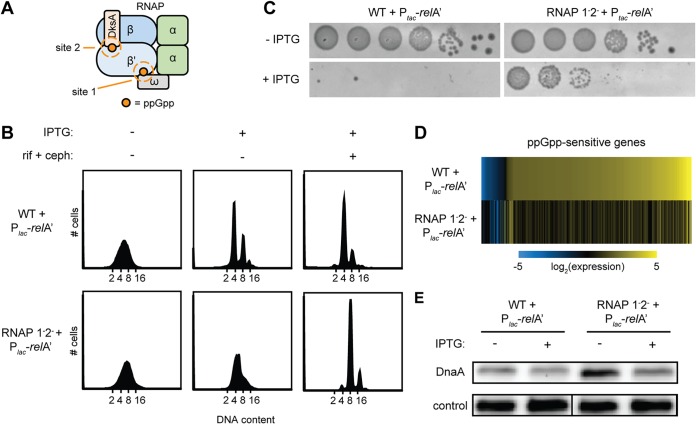
FIG 3.
RNAP mutants with decreased ppGpp-binding affinity continue DNA replication upon ppGpp induction. (A) Schematic of RNAP showing the ppGpp-binding sites (orange) mutated in the RNAP 1−2− strain. (B) Representative flow cytometry profiles of WT (top row) and RNAP 1−2− (bottom row) cells, each harboring the pRelA′ plasmid grown in M9GAV medium, treated as follows, and then fixed for analysis: pretreatment (left panel), RelA′ induction for 90 min by the addition of IPTG (50 μM to WT, 150 μM to RNAP 1−2−) (middle panel), and addition of rifampin (300 μg/ml) and cephalexin (12 μg/ml) to IPTG-treated cells for 4 h (right panel). (C) Serial dilution plating of WT and RNAP 1−2− cells, each harboring the pRelA′ plasmid, on M9GAV agar plates containing 0, 50 μM (WT), or 150 μM (RNAP 1−2−) IPTG and 100 μg/μl carbenicillin. Cells were grown to an OD600 of 0.2, and dilutions of 10−1 to 10−6 were plated. Plates were incubated for ∼24 h at 37°C. (D) RNAP 1−2− cells are transcriptionally blind to ppGpp induction. A heat map shows log2 fold changes for genes with expression changing >2 log2 in the WT or RNAP 1−2− strain 15 min following RelA′ induction with 50 μM (WT) or 150 μM (RNAP 1−2−) IPTG. Fold changes were calculated as a ratio of reads per kilobase per million (RPKM) between RNA harvested from samples collected 15 min after addition of IPTG and RNA from samples collected immediately prior to IPTG addition. (E) Representative immunoblot for DnaA in WT and RNAP 1−2− cells with and without the induction of RelA′ for 90 min with 50 μM (WT) or 150 μM (RNAP 1−2−) IPTG. The control is a nonspecific band seen with the DnaA antibody.

