Figure 1.

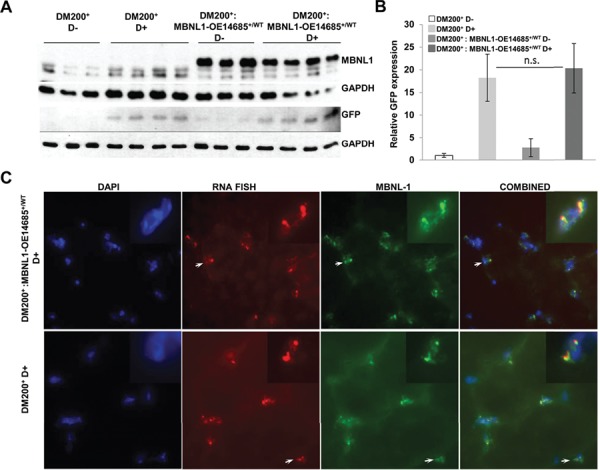
Characterization of DM200 mice overexpressing MBNL1. (A) Western blot analysis showing expression of MBNL1 in skeletal muscle (gastrocnemius/soleus) from DM200+ and DM200+: MBNL1-OE14685+/WT uninduced and induced mice (anti MBNL1-A2764 antibody). Western blot for GFP confirmed transgene induction. GAPDH was used as a loading control. (B) Quantification of the GFP expression from western blot in (A) shows no significant difference between DM200+- and DM200+: MBNL1-OE14685+/WT-induced mice. N = 3–4 mice per group. Errors bars are mean ± S.D. Student’s t-test used. n.s. indicates significance P-value > 0.05. (C) Immunofluorescence for MBNL1 (green) was performed using the M02-clone 3E7 (anti-MBNL1 monoclonal antibody, Abnova) in skeletal muscle (quadriceps femoris) from DM200+ and DM200+: MBNL1-OE14685+/WT mice induced for toxic RNA. RNA-FISH (red) was performed to study MBNL1 co-localization with RNA foci, with insets showing higher magnification focusing on indicated RNA foci. DAPI (blue) was used to stain nuclei. Representative images are also presented in Supplementary Material, Figure S4C.
