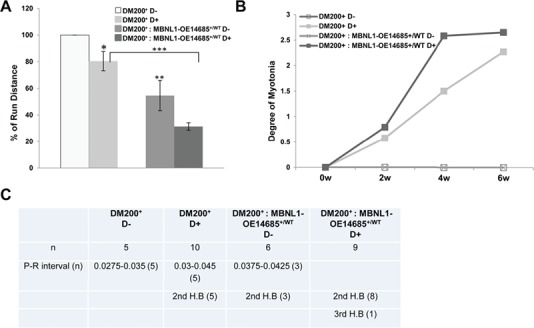
Figure 3.

Phenotypic analysis of MBNL1 overexpression. (A) Graph showing percent run distance (relative to pre-induction DM200+ D−) at the end of 6 weeks induction of toxic RNA. Run distance is significantly different between uninduced and induced DM200+ mice (P = 0.019), between DM200+: MBNL1-OE14685+/WT-uninduced and DM200+-uninduced mice (P = 0.01) and between DM200+ D+ and DM200: MBNL1-OE14685+/WT D+ mice (*P < 0.05, **P = 0.01, ***P = 0.000048); (n = 5 to 10/group). (B) Graph showing that there was no significant difference in myotonia between DM200:MBNL1-OE14685+/WT-induced and DM200+-induced mice at 6 weeks post-induction. For all graphs (in A and B), errors bars are mean ± standard error of the mean (SEM). Student’s t-test applied to all comparisons. (C) ECG studies in DM200+ and DM200+: MBNL1-OE14685+/WT mice induced for toxic RNA (n = 5 to 10 mice per group used in the study).
