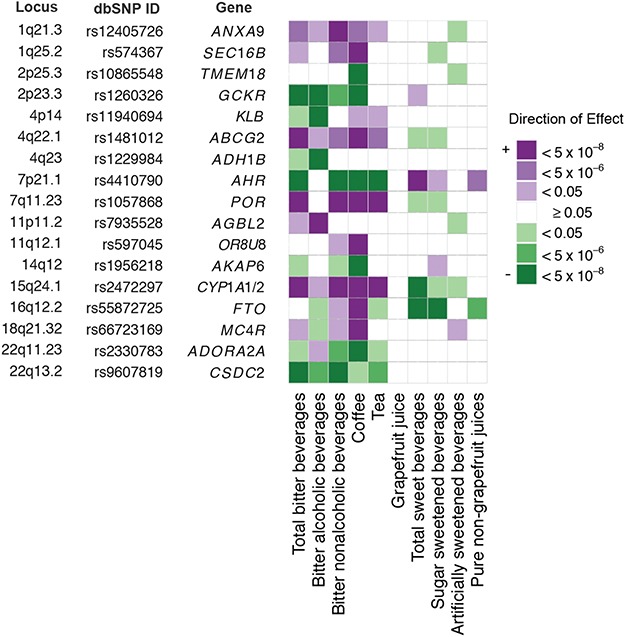
Figure 1.

Pleiotropic associations of beverage-based loci with different total and sub-types of beverages. Shown are the P values and direction of the associations between the most significant replicated independent SNP in each locus and each of the primary phenotypes and sub-phenotypes, based on joint meta-analysis of stage 1 and stage 2 samples. These SNPs were replicated for at least one primary phenotype or sub-phenotype. We chose the minor alleles as the effect alleles. Information on locus, SNP number and closest gene is presented here and further details can be found in Table 2. The direction and strength of the associations are indicated by color. Results with P ≥ 0.05 are not colored. Of note, a genome-wide significant SNP-phenotype association may be seen due to the very small P from stage 1 analysis, although this SNP did not satisfy our replication criteria as specified in methods (e.g. CYP1A1/2 for total sweet beverages).
