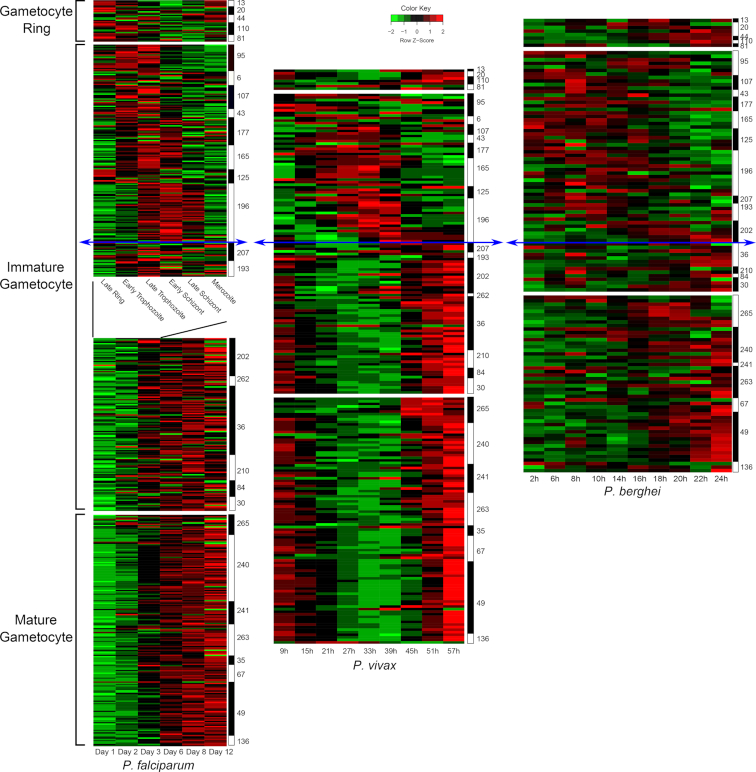
Figure 4.
Transcriptional profiles across gametocyte development and Plasmodium lineages. Time-course data (Log2 Fold change) of gametocyte-specific genes were extracted from previously published datasets. For P. falciparum data are used from an asexual time course (Le Roch et al. 2003)(top part, in hours) and a gametocyte time course (Young et al.2005)(bottom part, in days). For P. vivax, data are used from an ex vivo time course (Bozdech et al. 2008)(in hours), and for P. berghei data are from an in vivo time course (Hoo et al. 2016)(in hours). Comparing the temporal transcription of the gametocyte-specific genes as defined in Pelle et al. and their orthologues in P. berghei and P. vivax shows that their profile is qualitatively conserved. The initial phase of development from the gametocyte ring stage to early immature gametocyte development shows a similar cascade of gene expression and takes a similar amount of time across the three species (20–39 hours). In contrast further gametocyte maturation lasts significantly longer in P. falciparum (9–10 days) than in P. vivax (about 17–20 hours) and P. berghei (about 4 hours). These differences in maturation time are likely related to the physiological differences in their respective hosts. The numbers on the right side indicate the cluster number as defined previously (Pelle et al. 2015). The blue arrows separate the time courses between the initial stages of development (top) with conserved duration and the later stages with variable in time scale.

