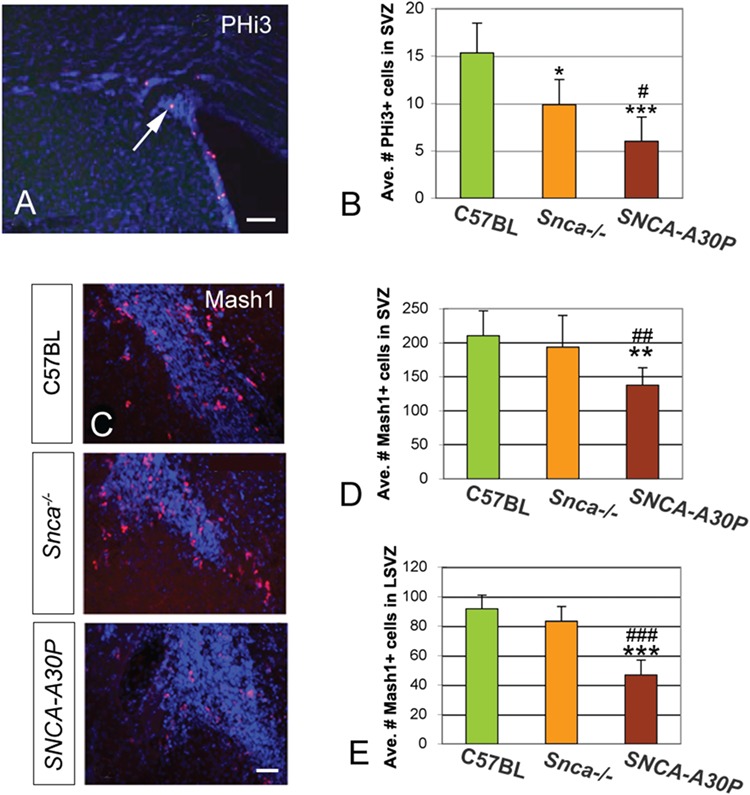
Figure 3.

Proliferation deceases in the SVZ of Snca−/− and SNCA-A30P mice. (A) PHi3 immunohistochemistry in the SVZ of C57BL/6 mice. Scale bar, 100 μm. (B) The average number of PHi3+ cells per SVZ decreased in Snca−/− compared to C57BL/6 mice. The average number of PHi3+ cells also decreased in the SNCA-A30P SVZ compared to both C57BL/6 and Snca−/− (DF = 59, F = 8.07). We included the dorsal, lateral, medial and anterior SVZ in this analysis. (C) Mash1 immunohistochemistry in the anterior SVZ in C57BL/6 and mutant mice. Scale bar, 50 μm. (D) The average number of Mash1+ cells decreased in the total SVZ of SNCA-A30P mice compared to C57BL/6 and Snca−/− (DF = 73, F = 5.69). (E) The average number of Mash1+ cells decreased in the LSVZ of SNCA-A30P mice compared to C57BL/6 and Snca−/− (DF = 51, F = 25.05).
