
Figure 6.
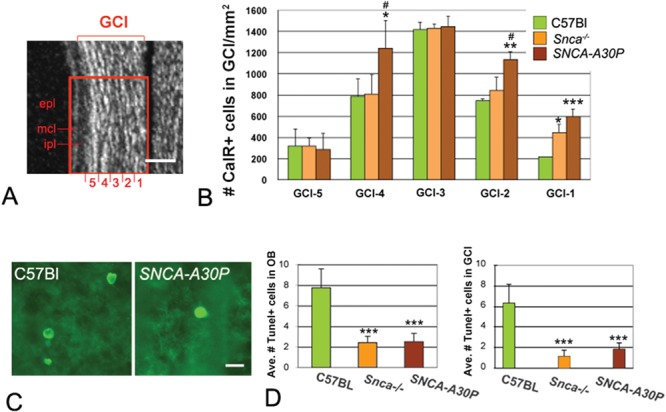
GCL CalR+ neurons and TUNEL+ cells in Snca−/− and SNCA-A30P mice. (A) DAPI stained section showing how the GCL was subdivided for quantification. ipl, internal plexiform layer; mcl, mitral cell layer; epl, external plexiform layer. Scale bar, 100 μm. (B) Quantification of CalR+ cells in the GCL (layer 1: DF = 35, F = 10.72; layer 2: DF = 35, F = 6.08; layer 3: DF = 35, F = 0.04; layer 4: DF = 35, F = 5.09; layer 5: DF = 35, F = 0.05). The reported cell numbers in B are densities of labelled cells per surface area. (C) TUNEL+ cells in the granule layer of the OB. Scale bar, 10 μm. (D) The average number of TUNEL+ cells was significantly decreased throughout the OB of Snca−/− and SNCA-A30P mice compared to C57BL/6 mice (DF = 35, F = 19.24). The average number of TUNEL+ cells was also significantly decreased in the GCL of Snca−/− and SNCA-A30P mice (DF = 30, F = 12.09).