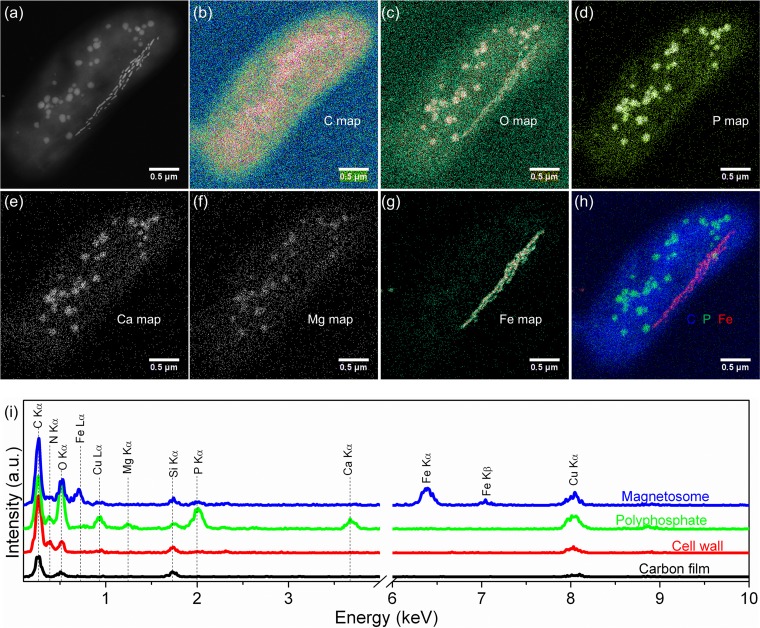
FIG 4.
HAADF STEM-EDX elemental mapping of a WYHR-1 cell. (a to g) HAADF-STEM image (a) and corresponding chemical maps of C (Kα) (b), O (O Kα) (c), P (P Kα) (d), Ca (Ca Kα) (e), Mg (Mg Kα) (f), and Fe (Fe Kα) (g). (h) RGB map with Fe (red), C (blue), and P (green). (i) EDX spectra extracted from the carbon film covering the TEM grid (black), cell wall (red), polyphosphate inclusion (green), and magnetosomes (blue).

