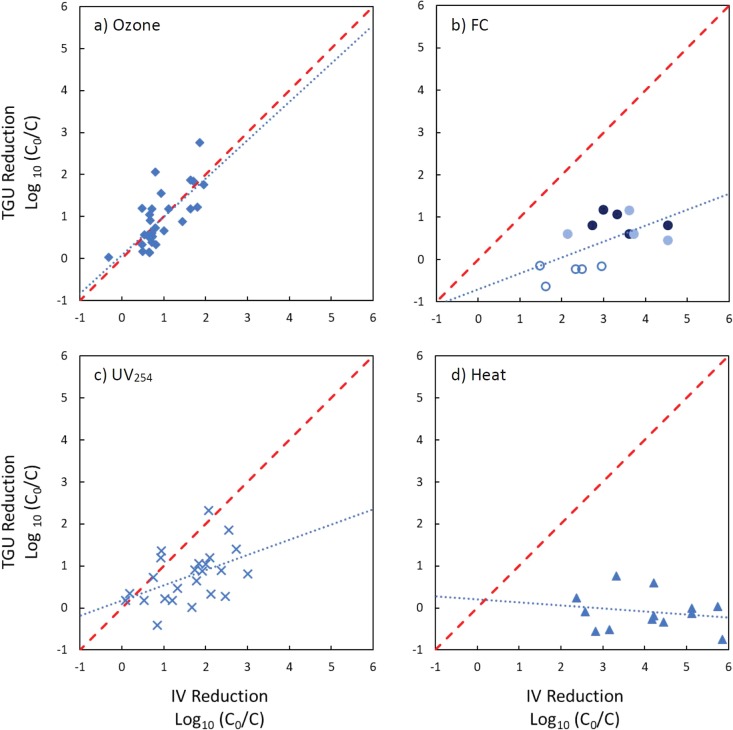
FIG 2.
Comparison of log10 reductions of infectious E11 (IV) and log10 reductions of genome functionality measured in transfectable genome units (TGUs) after inactivation by ozone (a), free chlorine (b), UV254 (c), and heat (d). C0 and C indicate the concentrations of TGU or IV prior to and after inactivation, respectively. Dashed lines represent a 1:1 relationship. The dotted line represents the linear regression calculated between infectious virus reductions and TGU reductions. For the graph panel b, FC concentrations are shown separately for 2 mg/liter (open circles), 2.5 mg/liter (light circles), and 3 mg/liter (dark circles); the regression line was calculated for all FC concentrations together.

