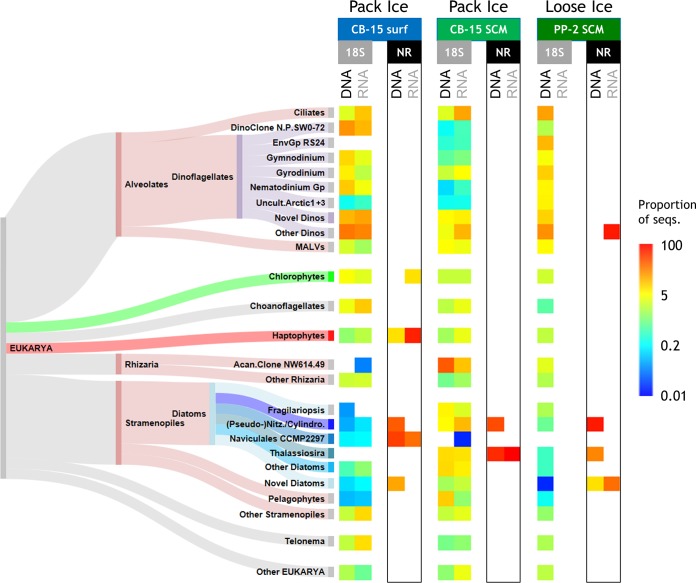
FIG 2.
Taxonomic distributions of 18S and NR sequences. Log-scale proportions of 18S HTS and NR cloned sequences, in both DNA- and RNA-sourced communities, are represented. Other than the “novel” (unclassified) and “other” categories, genus-equivalent taxa are shown if they represented at least 5% of the 18S sequences in at least one of the samples; due to their limited number, all NR sequences are shown. Note that no RNA remained for HTS analysis of PP-2 and the Sankey diagram of the taxa is not proportional to any sequence values but simply shows the relationships of the various taxa to the eukaryotic major groups and subgroups. Color schemes for the taxa match those in Fig. 3, 5, and 6; all dinoflagellates are in mauve, diatoms in shades of blue, chlorophytes in green, haptophytes in red, and the higher-rank SAR group in rose. Acan., Acantharea; Cylindro., Cylindrotheca; Dino(s), dinoflagellate(s); EnvGp, environmental (clone) group; Gp, group; MALVs, uncultured marine alveolates; Nitz., Nitzschia; N.P., North Pole; Uncult.Arctic1 + 3, uncultured arctic clades 1 and 3.

