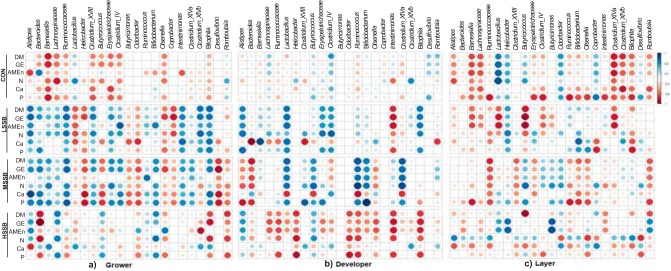
FIG 7.
Spearman nonparametric rank correlations between apparent retention of components and relative abundances of bacterial taxa in the ceca in the grower (a), developer (b), and layer (c) phases. All correlations presented were statistically significant (P < 0.05), with strong correlations indicated by large circles and weaker correlations indicated by small circles. The scale colors indicate whether the correlation is positive (closer to +1, blue circles) or negative (closer to −1, red circles) between the taxa and the apparent retention of components in each treatment. Doses (CFU/kg of feed) for B. subtilis DSM 29784: CON (control, no probiotic), LSSB (low SSB, 1.1E+08), MSSB (medium SSB, 2.2E+08), and HSSB (high SSB, 1.1E+09). AMEn, apparent metabolizable energy corrected for nitrogen.

