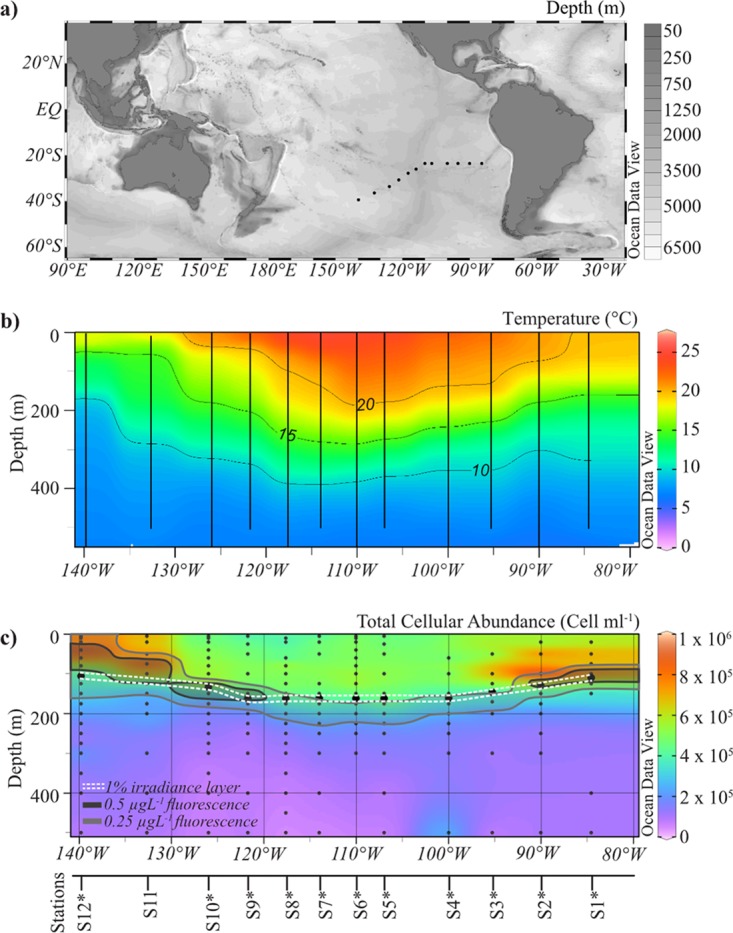
FIG 1.

(a) Map showing 12 sampling sites in the South Pacific Gyre, indicated by black dots. (b) Contour plots of temperature (degrees Celsius) data derived from CTD measurements at 12 stations during the SO-245 cruise with depths from 0 to 500 m. (c) Contour plot of total cellular abundance enumerated by DAPI staining (cells per milliliter) with depths from 0 to 500 m. The dashed white line represents the euphotic layer (meters). Also shown is the chlorophyll fluorescence, indicated by dark gray and light gray lines. The stations are indicated on the axis below the plots. All data are publicly available from Pangaea (51). All panels were created using Ocean Data View software (71).
