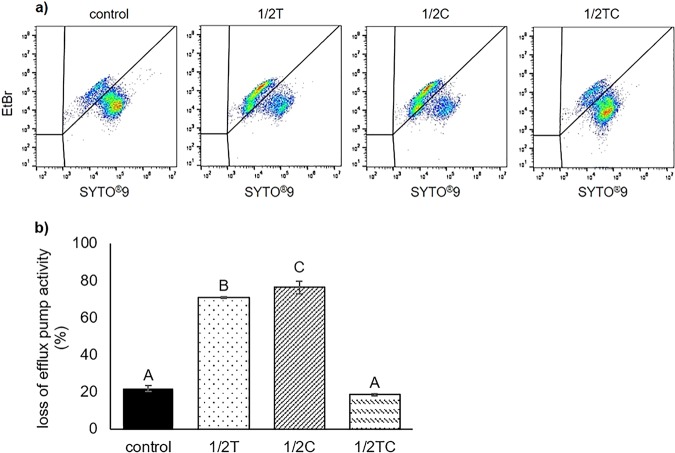
FIG 5.
Representative flow cytometry plots (a) and calculated percentage loss of efflux pump activity (b), assessed using SYTO9/EtBr stain, in nonadapted E. coli O157:H7 (control) and cells adapted to sublethal thymol (1/2T), carvacrol (1/2C), or trans-cinnamaldehyde (1/2TC). Different capital letters (A to C) represent statistically significant (P < 0.05) differences between control and EO-adapted cells.

