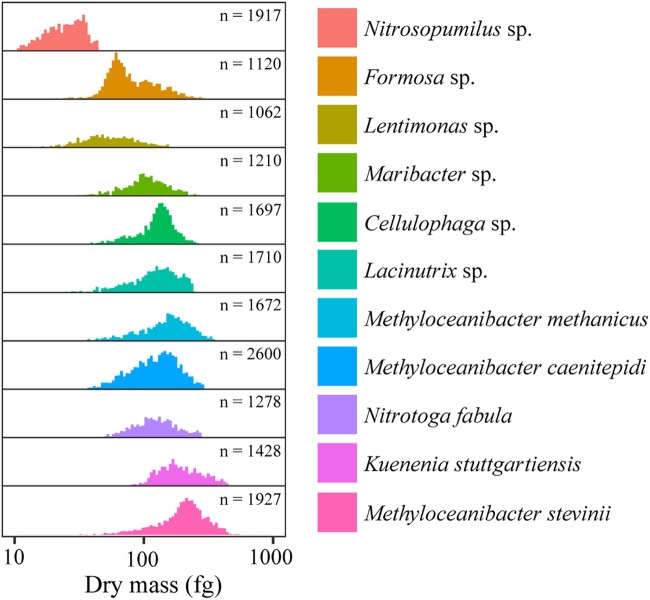
FIG 2.
Cellular dry mass distributions of the 12 investigated bacterial and archaeal species as determined with a suspended microchannel resonator (SMR). The microorganisms are ordered according to their increasing median cell volumes. Numbers of measured individual cells (n) that were used for the dry mass calculation are indicated. Note that the x axis represents a log scale of dry masses expressed in femtograms (1 fg = 10−15 g).

