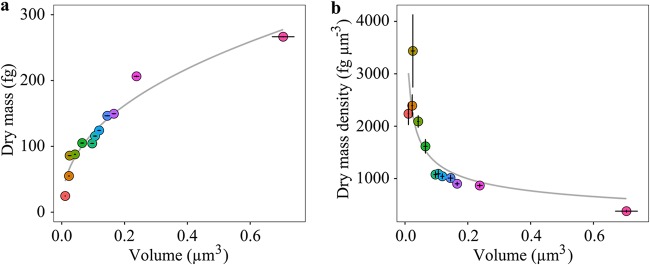
FIG 3.
Cellular dry mass scaling to cellular volume for the 12 investigated bacterial and archaeal species. (a) A significant (chi-square ANOVA, P < 0.005) nonlinear relationship exists between cellular volume and dry mass of the investigated species (). (b) A significant (chi-square ANOVA, P < 0.05) nonlinear relationship also exists between cellular volume and dry mass per unit cell volume (i.e., dry mass density; ). The gray lines represent best fits for the respective data, described by the equations for panel a and for panel b, where , , and V are dry mass in femtograms, dry mass density in femtograms per cubic micrometer, and volume in cubic micrometers, respectively. Error bars indicate SEs. Color coding of the individual data points corresponds to the color coding of the investigated species outlined for Fig. 2.

