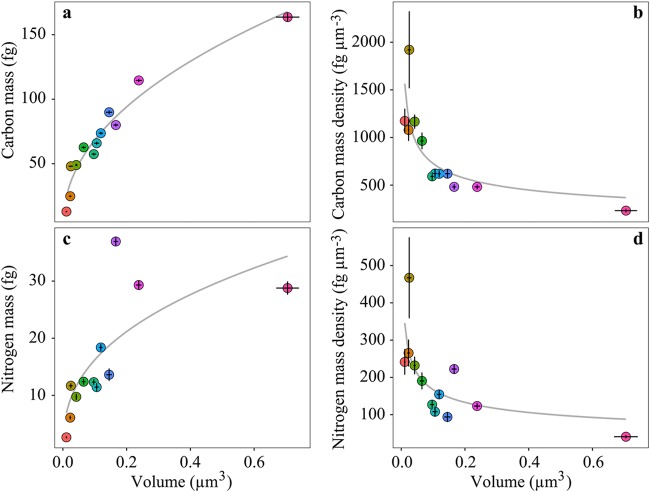
FIG 5.
Cellular carbon and nitrogen mass scaling to volume. (a) A significant (chi-square ANOVA, P < 0.005) nonlinear relationship exists between cellular volume and carbon mass (). (b) A significant (chi-square ANOVA, P < 0.05) nonlinear relationship also exists between cellular volume and carbon mass density (carbon mass per unit cell volume, ). Significant (chi-square ANOVA, P < 0.05) nonlinear relationships also exist between between cellular volume and nitrogen mass () (c) and cellular volume and nitrogen mass density (nitrogen mass per unit cell volume, ) (d). Gray lines represent best fits, described by the equations for panel a, for panel b, for panel c, and for panel d, where and are carbon and nitrogen masses in femtograms, and are carbon and nitrogen mass densities in femtograms per cubic micrometer, and V is cell volume in cubic micrometers. Error bars indicate SEs. Color coding of the individual data points corresponds to the color coding of the investigated species outlined for Fig. 2.

