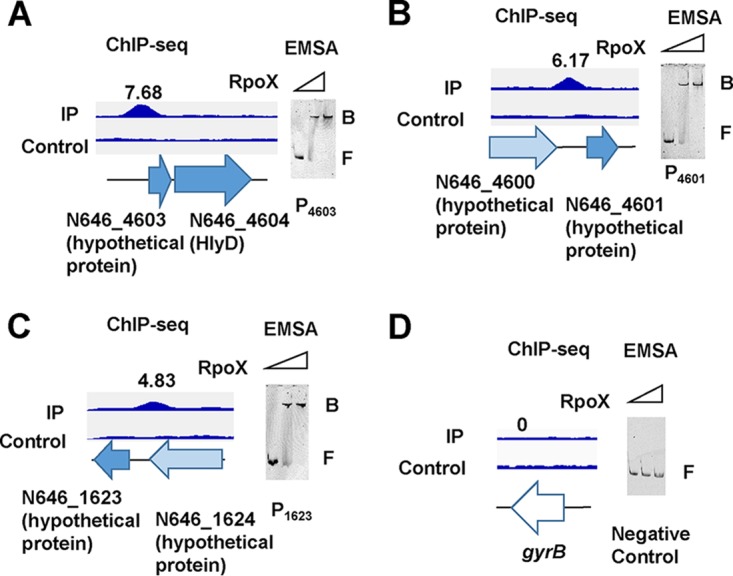
FIG 5.

ChIP-seq analysis of genes directly bound and regulated by RpoX. (A to C) N646_4603 (A), N646_4601 (B), and N646_1623 (C) were used for peak comparison of ChIP-seq (left) and EMSA (right) results. The fold enrichment of each of the typical promoters bound by RpoX is shown. (D) A 300-bp fragment of the gyrB promoter region is shown as the negative control, which cannot be bound by RpoX. B, bound DNA; F, free DNA. The numbers above each of the peaks indicate the enrichment fold change relative to the control.
