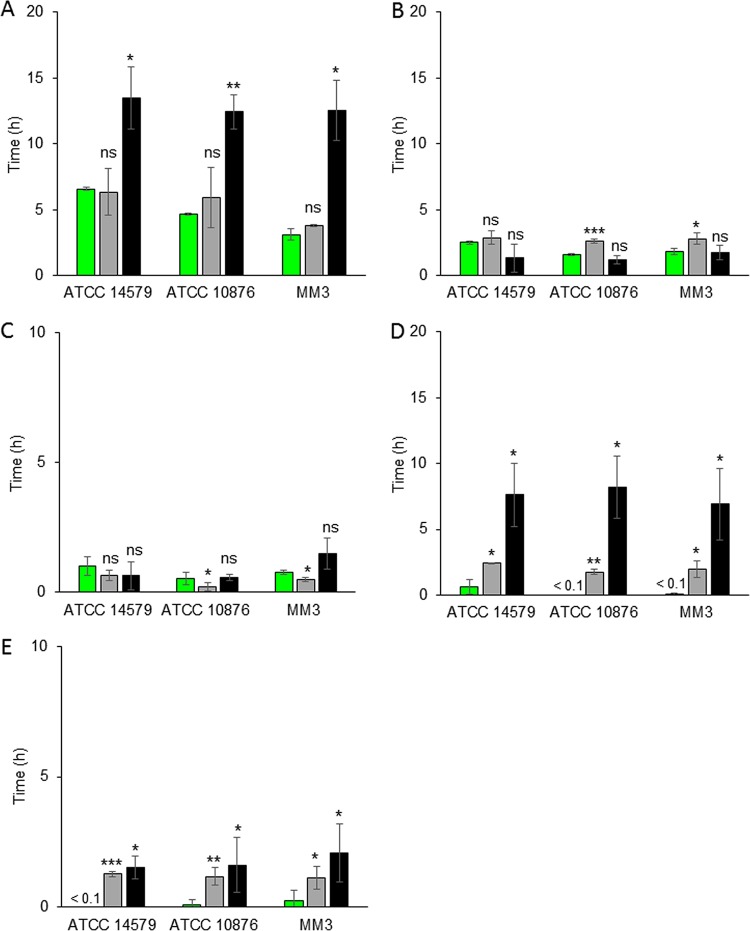
FIG 2.
Times of onset of cshA promoter activity (λF) (green bars), an A600 increase (λA) (gray bars), and a plate count increase (λC) (black bars) (values are the mean ± SD; n = 3). Experiments were done at 12°C (A), 20°C (B and D), or 30°C (C and E) and at pH 7.0 (A, B, and C) or pH 5.0 (D and E) for B. cereus sensu lato ATCC 14579, ATCC 10876, and MM3. The notation <0.1 indicates that λF is shorter than 0.1 h. Asterisks above the bars show significant differences (determined by Student's t test) between λF and λA or λC. *, P < 0.05; **, P < 0.01; ***, P < 0.001; ns, no significant difference.

