FIG 1.
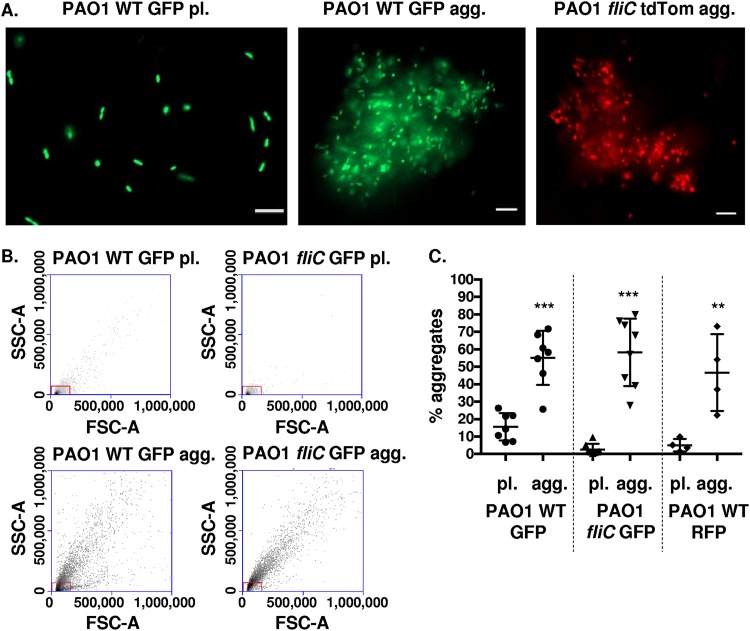
Wild-type and nonmotile P. aeruginosa (PAO1) cells form aggregates. (A) P. aeruginosa bacteria were assayed for the formation of bacterial aggregates. Representative images of planktonic (pl.) PAO1 WT GFP bacteria (left), PAO1 WT GFP aggregate (agg.) bacterial culture (middle), and PAO1 fliC tdTomato agg. (right) culture. GFP-expressing PAO1 WT and tdTomato-expressing PAO1 fliC are shown in green and red colors, respectively (×20 magnification). Bar, 10 μm. (B) Flow cytometry to assess and quantify bacterial aggregate formation compared to planktonic cultures. Representative side-scatter area (SSC-A; y axis) and forward-scatter area (FSC-A; x axis) plots of PAO1 WT GFP (pl. and agg.) and PAO1 fliC GFP (pl. and agg.), as indicated. The red boxes indicate gates for planktonic bacteria. (C) Quantification of aggregate formation using the methodology shown in (B). The y axis, percentage aggregates, represents the percentage of bacteria outside the gate set in panel B. Data, analyzed using one-way analysis of variance (ANOVA) with Tukey’s post hoc analysis, are representative of at least four independent biological experiments (n ≥ 4). ***, P ≤ 0.0005; **, P ≤ 0.005, compared to planktonic bacterial cultures.

