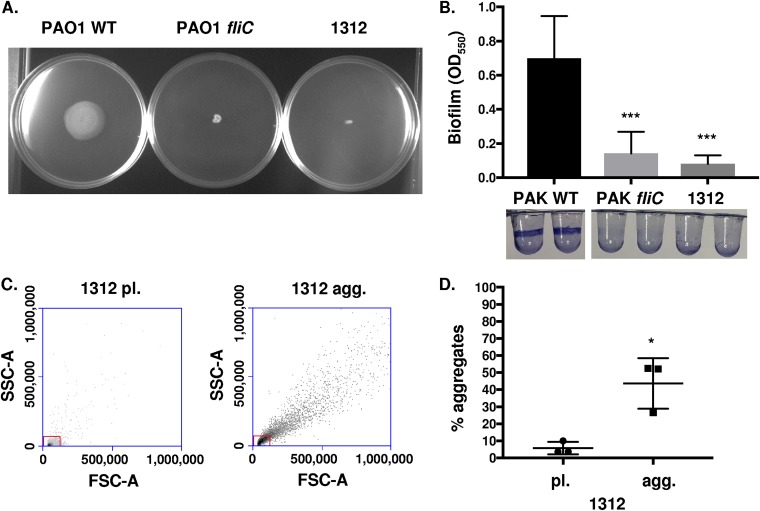
FIG 6.
Formation of aggregates by a nonmotile P. aeruginosa clinical isolate. (A) PAO1 WT, PAO1 fliC, and clinical isolate 1312 of P. aeruginosa, as indicated, were assayed for swimming motility in LB media containing 0.3% agar. (B) P. aeruginosa clinical isolate 1312 was assessed for its ability to form surface-adhered biofilms, with PAK WT and PAK fliC bacteria used as positive and negative controls, respectively. Staining with 0.1% crystal violet was used to view and quantitate biofilm formation. (C) Flow cytometry was used to quantify isolate 1312 bacterial aggregate formation compared to that of planktonic cultures, based on scatter. The boxes delineate the gate for planktonic bacteria. (D) Quantification of aggregate formation by isolate 1312, performed by the same methodology as that in Fig. 1. Data for panel B were analyzed using one-way ANOVA with Tukey’s post hoc analysis, while data for panel D were analyzed using an unpaired t test with Welch’s correction. All data are representative of at least three independent biological experiments (n ≥3). ***, P ≤ 0.0005; *, P ≤ 0.05, compared to PAK WT in panel B and pl. 1312 in panel D.

