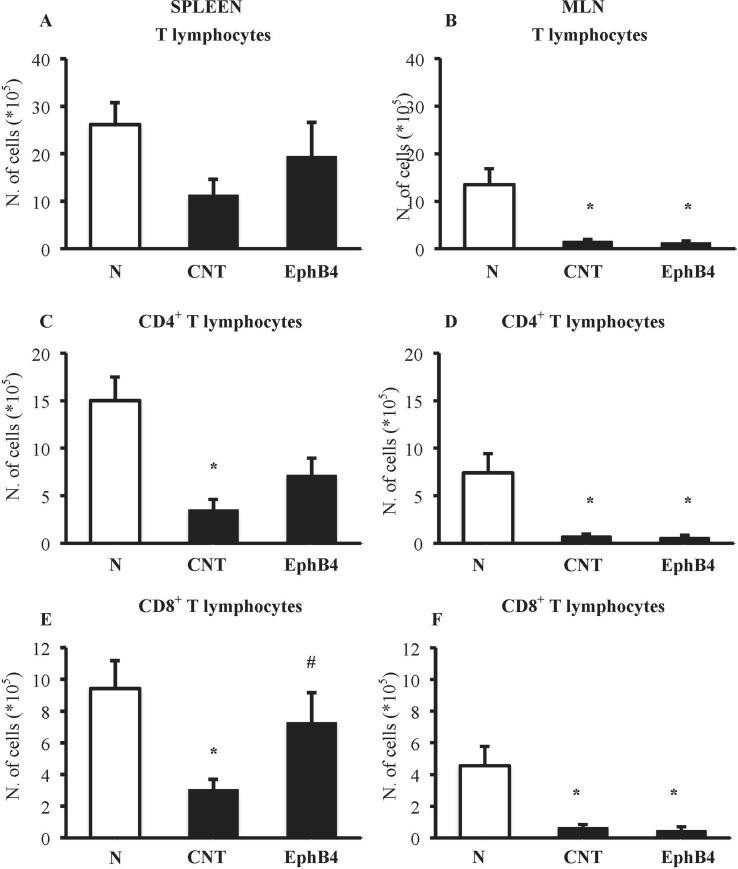
Figure 6.
EphB4 attenuated TNBS-induced changes in spleen T-cell profile. Number of T lymphocytes (CD3+) (A, B), CD4+ (C, D), and CD8+ (E, F) T lymphocytes in the spleen (A, C, E) and in MLN (B, D, F) excised from vehicle-treated normal mice (N) and TNBS-treated mice administered with vehicle (CNT) or EphB4 20 µg/kg (EphB4) (n = 5–9 independent values per group). *P < 0.05 vs. N mice; # P < 0.05 vs. CNT mice, one-way ANOVA followed by Bonferroni’s post-test.

