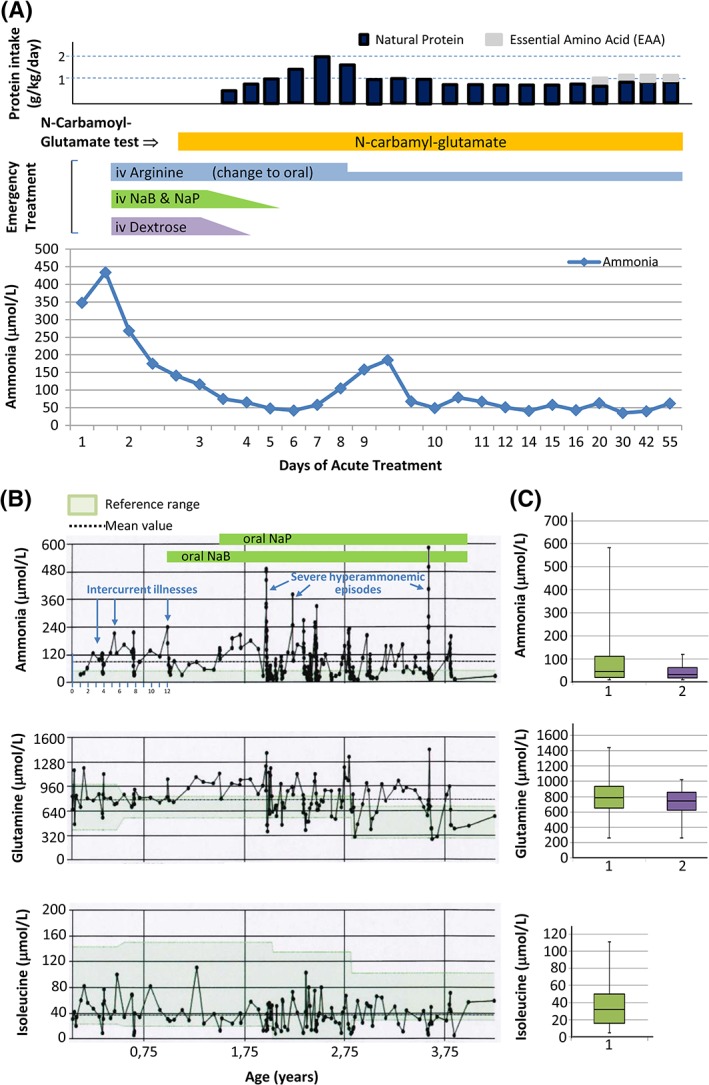
Figure 1.

Patient data. NaB and NaP stand for Na benzoate and Na phenylbutyrate, respectively. A, Protein intake (top), administration of drugs (middle), and ammonia levels (bottom) until metabolic stabilization during the first hyperammonemic crisis, plotted vs days from start of intervention (day 1 corresponds to day 9 of life). B, Lifelong levels of plasma ammonia (top), glutamine (middle), and isoleucine (bottom), excluding the initial period of presentation and stabilization. The colored horizontal bands denote the addition of ammonia scavengers, as indicated, to the treatment regime of the patient. Arrows indicate febrile events associated with increased ammonia levels and very severe events that required hemofiltration, as specified. C, Corresponding boxplots for the lifelong ammonia, glutamine, and isoleucine levels including (1) or excluding (2) levels during periods of decompensation. EAA, essential amino acid
