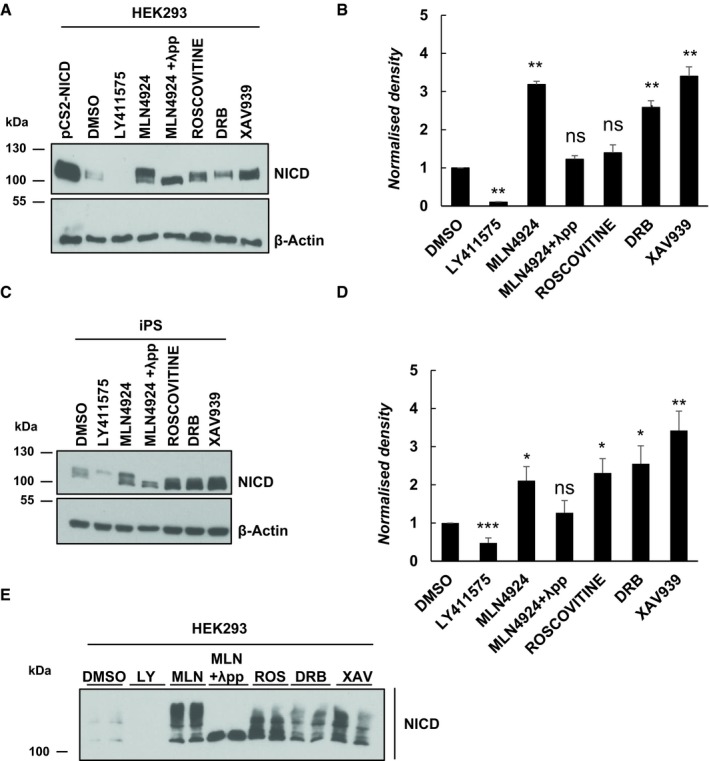
Figure 1. Endogenous NICD levels increase in HEK293 cells following treatment with Roscovitine, DRB and XAV939.

- HEK293 cells were treated for 3 h with 150 nM of LY411575, 1 μM of MLN4924, 10 μM of Roscovitine, 10 μM DRB or 10 μM XAV939. DMSO served as vehicle control. Transfection with pCS2‐NICD vector served as positive control. Western blot analysis reveals that NICD levels were increased upon treatment with Roscovitine, DRB, XAV939 or MLN4924. NICD is undetectable following LY411575 treatment. NICD antibody detects a doublet following inhibitor treatment, and the top band disappears following λ phosphatase treatment indicating that this top band is a phosphorylated isoform. β‐Actin served as loading control.
- Quantification of the density of Western blot bands in (A) using ImageJ software. Data are expressed as fold changes compared to DMSO treatment. All data represent the mean ± SEM from three independent experiments. One‐way ANOVA analysis, followed by Dunnett's test, was performed with **P ≤ 0.01 and ns = not significant.
- iPS cells were treated for 3 h with 150 nM of LY411575, 1 μM of MLN4924, 10 μM of Roscovitine, 10 μM DRB or 10 μM XAV939. DMSO has been used as vehicle control. Western blot analysis reveals that NICD levels were increased upon treatment with Roscovitine, DRB, XAV939 or MLN4924. NICD is undetectable following LY411575 treatment. NICD antibody detects a doublet following Inhibitor treatment and the top band disappears following λ phosphatase treatment indicative that this top band is a phosphorylated isoform. β‐Actin served as loading control.
- Quantification of the density of Western blot bands in (C) using ImageJ software. Data are expressed as fold changes compared to DMSO treatment. All data represent the mean ± SEM from three independent experiments. One‐way ANOVA analysis, followed by Dunnett's test, was performed with *P ≤ 0.05, **P ≤ 0.01, ***P ≤ 0.001 and ns = not significant.
- HEK293 cells were treated with the same inhibitors as described in (A). NICD phosphorylation status was analysed by a Phos‐tag assay. DMSO served as vehicle control. NICD phosphorylation profile varies following Roscovitine, DRB, XAV939 or MLN4924 treatment. Following λ phosphatase treatment, none of the high molecular weight bands are visible indicating they are all phosphorylated isoforms.
