
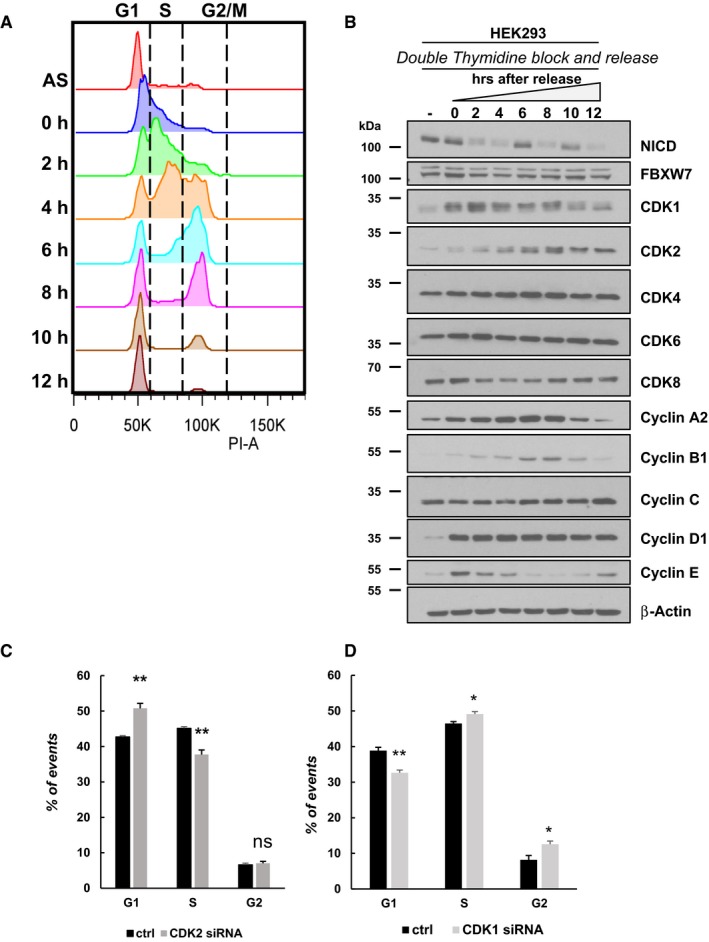
Figure 5. NICD levels fluctuate during the cell cycle.
-
ACell cycle profile for HEK293 cells released from synchronization after double thymidine block. Cells were released and harvested at the indicated time points (AS = asynchronous). Analysis of cell cycle arrest and release was performed using propidium iodide (PI) staining and flow cytometry. A representative experiment of three performed is shown.
-
BExpression of the indicated proteins in HEK293 cells was examined by Western blotting, and β‐actin was used as loading control. This summary is a representation of three independent experiments.
-
C, DGraph of flow cytometry data shows the percentage of cells in given cell‐cycle phases 48 h after transfection with plasmids encoding scrambled siRNA or siRNA specific for CDK2 (C) or CDK1 (D). Graphs represent the mean of three independent experiments. All data represent the mean ± SEM from three independent experiments. Student's t‐test analysis was performed, with *P ≤ 0.05 and **P ≤ 0.01 (ns = not significant).