
Figure 6. NICD levels peak in G1 and G2 phases of the cell cycle for iPS cells.
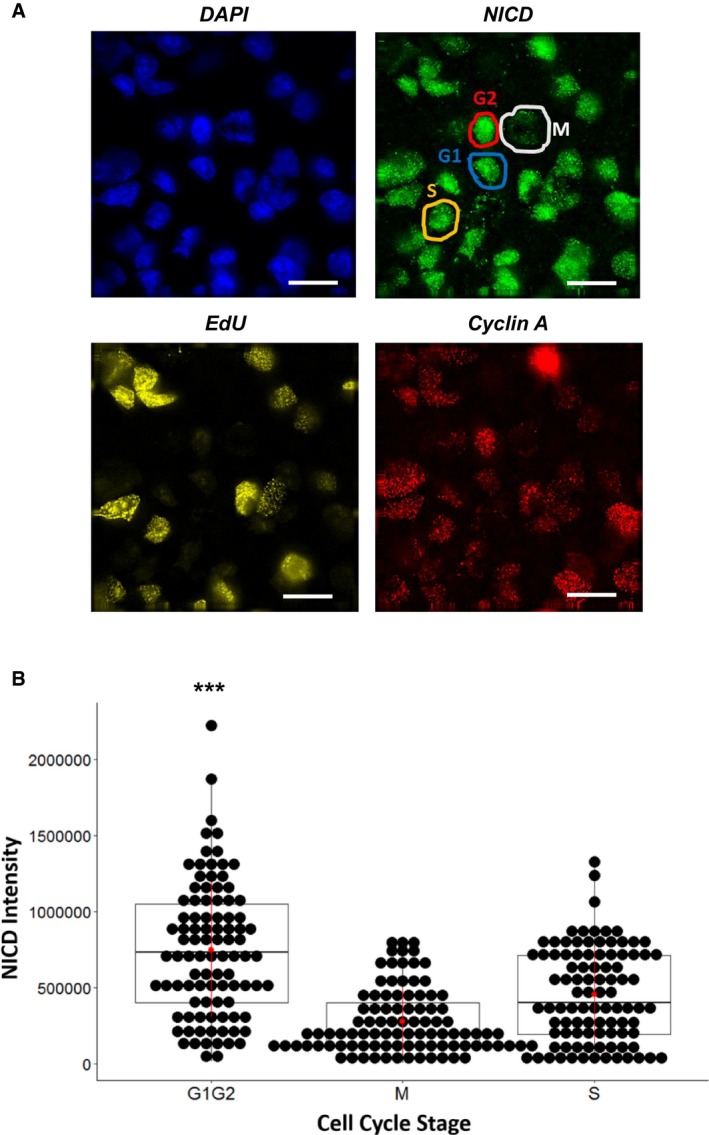
- iPS cells in G2 express high levels of Cyclin A and do not incorporate EdU (marked in red within the NICD panel). EdU incorporation occurs during S phase (marked by yellow in the NICD panel). Cells with low Cyclin A intensity and no EdU incorporation are either in G1 or M phase. M phase cells are distinguishable by their chromatin condensation, observable in the DAPI panel (dividing cells are indicated with white in the NICD panel). G1 cells do not have any of the features described above (blue in NICD panel). Scale bars are 20 μm.
- G1 and G2 phase cells have significantly higher NICD protein levels than S and M stage cells (P ≤ 0.001). All groups were compared against each other with a one‐way ANOVA analysis, followed by Tukey's test. M phase cells have the lowest NICD. Each point in the box‐plot represents the normalized intensity of a single cell. Data from three different experiments (n = 3) were randomized collated and plotted.