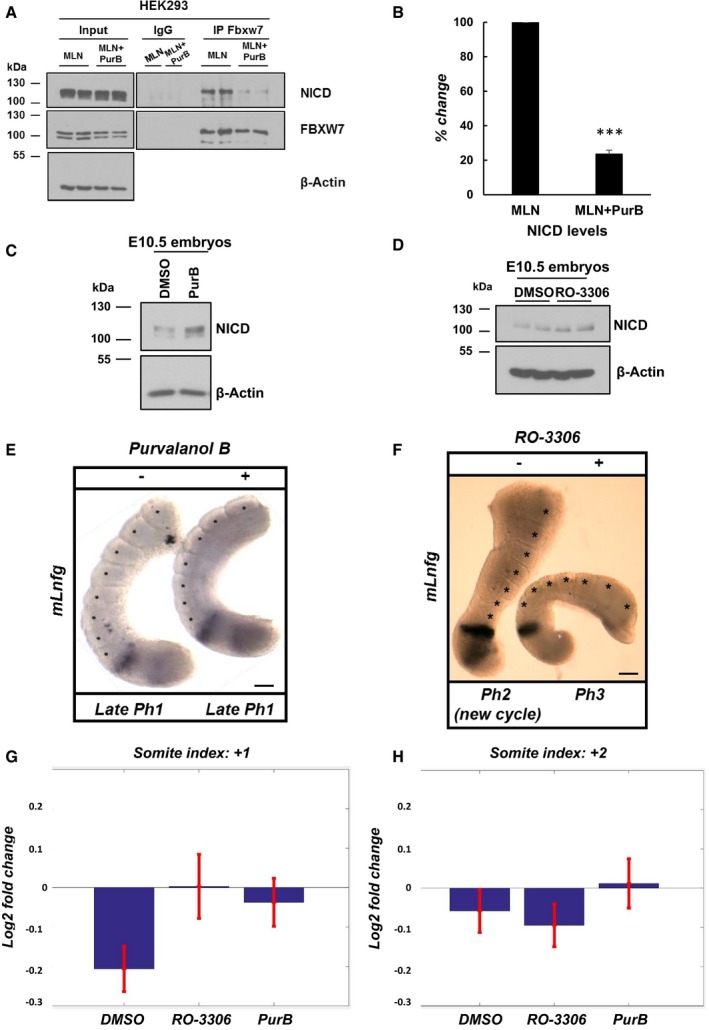
Purvalanol B treatment reduced the NICD‐FBXW7 interaction. 200 μg of HEK293 cell lysates treated with MLN4924 or MLN4924 in combination with 0.1 μM of Purvalanol B was subjected to immunoprecipitation using FBXW7 antibody, or IgG antibody as negative control, and precipitated material was analysed by Western blot using NICD antibody. Western blot with FBXW7 antibody served as loading control for immunoprecipitation efficiency. 10% of cell lysate before immunoprecipitation was used as input control and β‐actin has been used as loading control.
Quantification of the density of Western blot bands in (A) performed by ImageJ software. Data are expressed as percentage changes compared to MLN4924‐treated samples. All data represent the mean ± SEM from three independent experiments. Student's t‐test analysis was performed, with ***P ≤ 0.001.
E10.5 mouse tails were bisected down the midline. One half (+) was cultured for 4 h in the presence of Purvalanol B (1 μM). The contralateral half (−) was cultured for 4 h in the presence of DMSO. Control or treated explants were pooled, and NICD levels were detected by Western blot. β‐Actin was used as loading control.
E10.5 mouse tails were bisected down the midline. One half (+) was cultured for 4 h in the presence of RO‐3306 (10 μM). The contralateral half (−) was cultured for 4 h in the presence of DMSO. Control or treated explants were pooled, and NICD levels were detected by Western blot. β‐Actin has been used as loading control.
Bisected E10.5 mouse PSM explants were cultured in the absence (−) or presence (+) of 1 μM of Purvalanol B for 4 h and then analysed by in situ hybridization for mLfng mRNA expression. Purvalanol B‐treated explant has one less somite than the control explant, and the treated explant is in the same late phase 1 of the oscillation cycle of dynamic mLfng mRNA expression indicating it is a whole cycle delayed compared to the “−” explant. n = 18. Scale bar is 100 μm.
Bisected E10.5 mouse PSM explants were cultured in the absence (−) or presence (+) of 10 μM of RO‐3306 for 4 h and then analysed by in situ hybridization for mLfng mRNA expression. RO‐3306‐treated explant is two phases behind in the oscillation cycle of dynamic mLfng mRNA expression indicating there is a delay in the oscillation compared to the “‐” explant. n = 10. Scale bar is 100 μm.
The mean log2 fold change in successive somite length at position +1 (last formed somite) is plotted for different treatment conditions. Error bars denote standard error of the mean. Paired t‐test analysis was performed at 5% significance level, with P = 0.0437 for RO‐3006 and P = 0.0524 for PurB, compared to DMSO. n = 14.
The mean log2 fold change in successive somite length at position +2 (penultimate formed somite) is plotted for different treatment conditions. Error bars denote standard error of the mean. Paired t‐test analysis was performed at 5% significance level, with P = 0.6409 for RO‐3006 and P = 0.4065 for PurB, compared to DMSO. n = 14.

