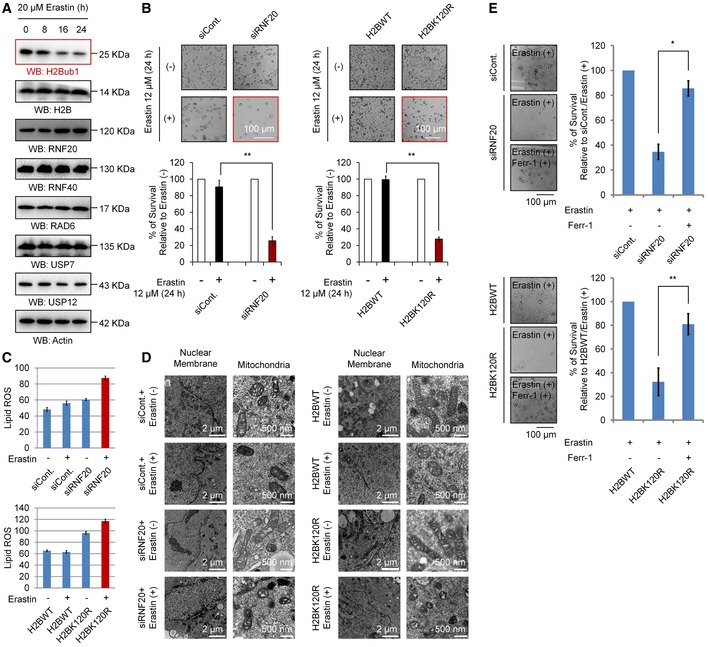
Western blot analysis of 293T cells treated with 20 μM erastin for the indicated times.
H1299 cells transfected with a control siRNA (siCont.) or an RNF20‐specific siRNA (siRNF20) and a wild‐type H2B (H2BWT) or a K120R‐mutated H2B (H2BK120R) were treated with 12 μM erastin (+) or untreated (−) for 24 h. Representative phase‐contrast images were recorded (magnification, ×20), and the surviving cells were counted.
Lipid ROS levels were assessed by flow cytometry after C11‐BODIPY staining in cells treated as in (B).
H1299 cells treated as in (B) were subjected to transmission electron microscopy. Representative images are shown.
Control H1299 cells (transfected with siCont. or H2BWT) and H2Bub1‐depleted H1299 cells (transfected with siRNF20 or H2BK120R) were treated with erastin either with or without a ferroptosis‐specific inhibitor, ferrostatin‐1 (2 μM), for 24 h. Representative phase‐contrast images were recorded (magnification, ×20), and the surviving cells were counted.
Data information: Bars and error bars are mean ± s.d.,
n = 3 independent repeats. Two‐tailed unpaired Student's
t‐test was performed. *
P < 0.05, **
P < 0.01.

