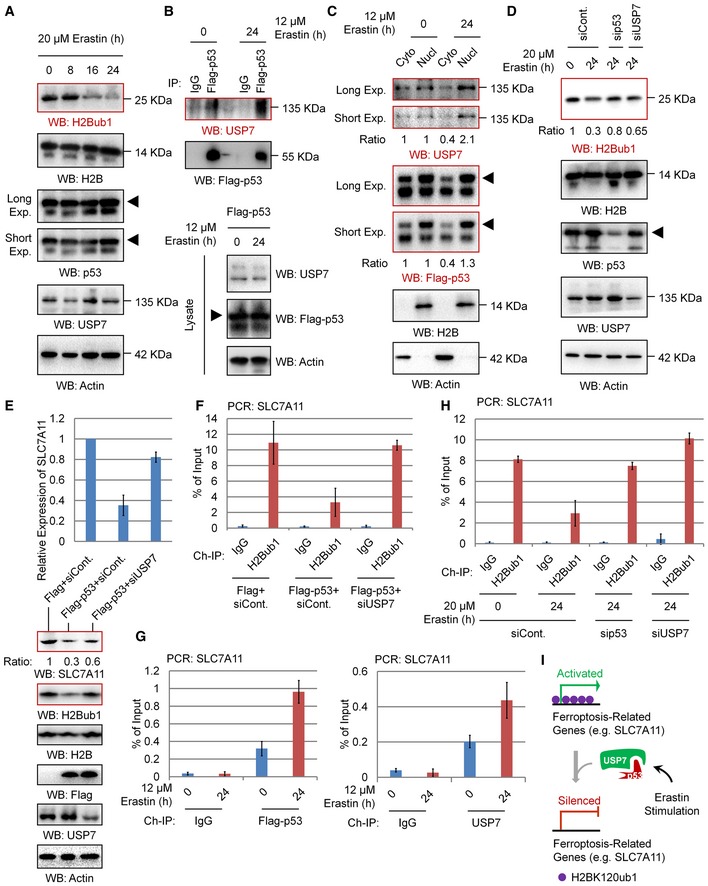
Western blot analysis of 293T cells treated with 20 μM erastin for the indicated times.
H1299 cells were transfected with Flag‐tagged p53 for 24 h and then treated with 12 μM erastin or untreated for another 24 h. Co‐IP analysis was performed with antibodies against Flag.
H1299 cells transfected with Flag‐tagged p53 were treated with erastin or untreated for 24 h. Nuclear and cytosolic extracts were differentially prepared and subjected to Western blot analysis.
293T cells transfected with a p53‐specific siRNA, a USP7‐specific siRNA, or a control siRNA (siCont.) were treated with 20 μM erastin or untreated for 24 h as indicated. Western blot analysis was then performed.
qRT–PCR (above) and Western blot (below) analyses for H1299 cells transfected with a Flag‐tagged p53 or an empty plasmid together with a USP7‐specific siRNA or a control siRNA (siCont.) as indicated.
ChIP analysis of H1299 cells transfected with a Flag‐tagged p53 or an empty plasmid together with a USP7‐specific siRNA or a control siRNA (siCont.) as indicated.
H1299 cells transfected with Flag‐tagged p53 were treated with 12 μM erastin or untreated for 24 h. ChIP analysis with antibodies against Flag or USP7 was performed.
293T cells transfected with a p53‐specific siRNA, a USP7‐specific siRNA, or a control were treated with 20 μM erastin or untreated for 24 h. ChIP analysis was performed with anti‐H2Bub1 antibodies.
A proposed working model for the p53‐USP7‐H2Bub1 axis in the regulation of SLC7A11 expression.
= 3 independent repeats.

