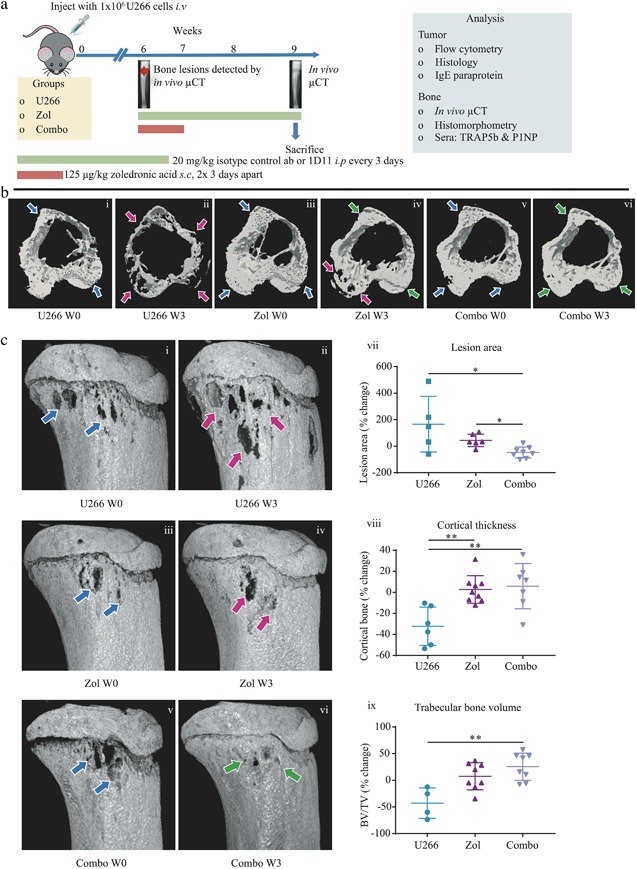
Figure 4.

Zol and 1D11 combination therapy repaired osteolytic bone lesions in the U266 murine model of myeloma. (A) Schematic demonstrating the treatment schedule for Zol monotherapy or Zol and 1D11 combined (Combo) in the U266 model of myeloma. (B) W0: Time of bone disease presentation (approximately 6 weeks post‐U266 injection). W3: 3 weeks after treatment. Representative 3D transverse cortical and trabecular registered in vivo μCT images from the tibias of U266 vehicle W0 (U266 W0) (i), U266 vehicle W3 (U266 W3) (ii), U266 + Zol W0 (Zol W0) (iii), U266 + Zol W3 (Zol W3) (iv), U266 + Combo W0 (Combo W0) (v), and U266 + Combo W3 (Combo W3) (vi) mice. (C) Representative longitudinal in vivo μCT images from the tibias of U266 W0 (i), U266 W3 (ii), Zol W0 (iii), Zol W3 (iv), Combo W0 (v), and Combo W3 (vi) mice. Blue arrows represent initial bone disease, pink arrows represent progressive bone disease, and green arrows represent a reduction in bone disease and lesion repair. Percentage change in lesion area (vii) from W0 to W3 by in vivo μCT, after image registration. Percentage change in cortical thickness (viii) from W0 to W3 by in vivo μCT. Percentage change in BV/TV (ix) from W0 to W3 by in vivo μCT. All data are presented as mean ± SD, Kruskal‐Wallis and Dunn's multiple comparison tests, *p ≤ 0.05 and **p ≤ 0.01.
