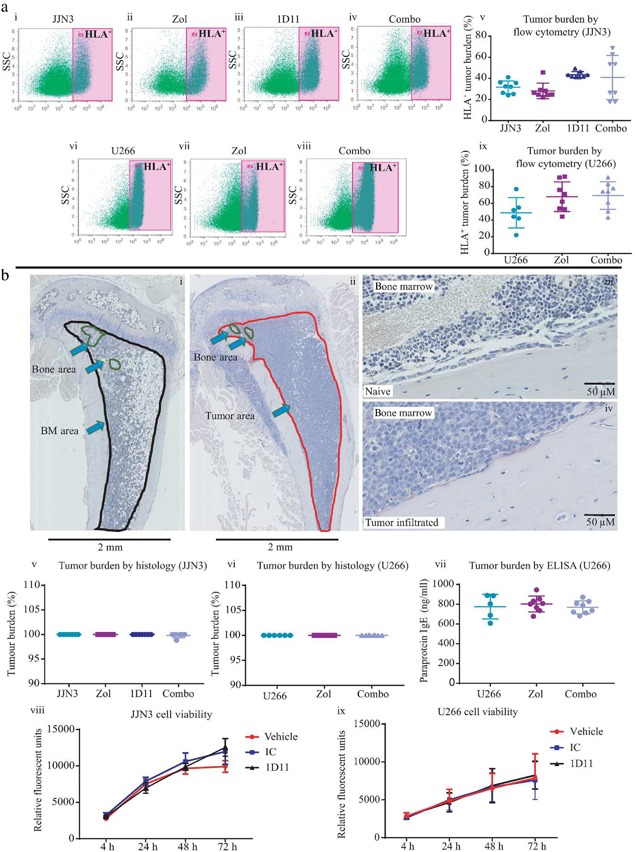
Figure 6.

1D11 did not inhibit the growth of JJN3 or U266 cells in vivo or in vitro. (A) Representative flow cytometry dot plots showing HLA‐positive tumor cells from femora bone marrow flushes from JJN3‐bearing (i–iv) or U266‐bearing mice (vi–viii) treated with IC (JJN3 or U266) (i, vi), Zol (ii, vii), 1D11 (iii), or Combo (iv, viii), quantified as a percentage of tumor burden (v, ix). (B) Representative paraffin‐embedded hematoxylin‐stained bone marrow sections taken from Naïve (i ×2, iii ×40) or JJN3/U266‐bearing mice (ii ×2, iv ×40) demonstrating how percentage of tumor area is quantified using Image Scope software, normal marrow circled in black (i), bone area in circled green (i, ii), tumor area circled in red (ii). Quantification of histological tumor burden in paraffin‐embedded tibia sections taken from JJN3‐bearing mice (v) or U266‐bearing mice (vi) and treated with IC, Zol, 1D11, or Combo, quantified using Image Scope Software, as shown above, displayed as a percentage of tumor in the bone marrow compared with normal marrow. IgE paraprotein present in the sera of U266‐bearing mice at the end stage of disease, treated with IC, Zol, or Combo and analyzed by ELISA (vii). In vitro culture of JJN3 (viii) and U266 (ix) cells treated with vehicle (CRTL), IC, or 1D11 for 4 hours, 24 hours, 48 hours, and 72 hours. All data are presented as mean ± SD.
