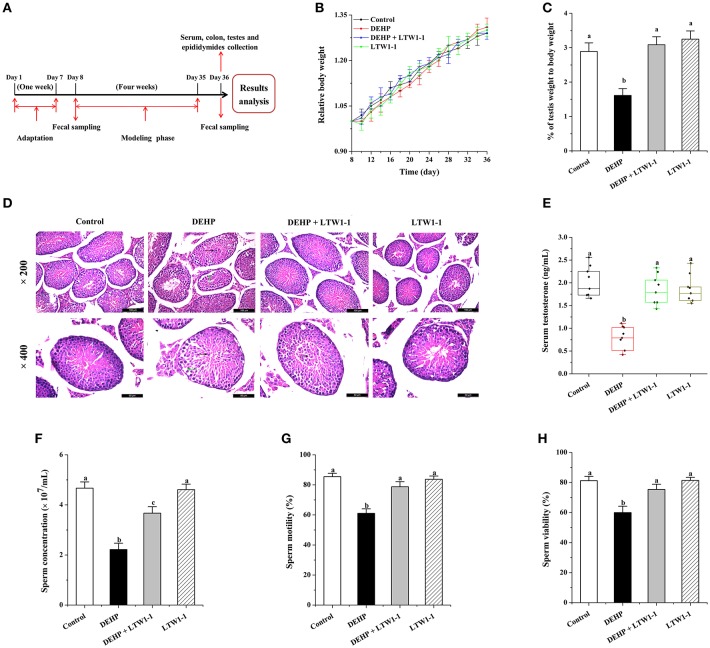
Figure 1.
Effects of L. plantarum TW1-1 treatment on mouse growth and development in the different groups. (A) Experimental design. (B) The relative body weight curve of the four groups of mice during the 4 weeks of intervention. The relative body weight was calculated as the percentage of baseline weight for each mouse. (C) Average testis weight relative to the body weight for each mouse. (D) Photomicrographs of Hematoxylin and eosin stained testicular sections. Green arrows indicate the seminiferous tubules with reduced thickness of the germinal epithelium and black arrows indicate an irregular arrangement of germ cells in the seminiferous tubules with exfoliation of germ cells into the lumen. (E) Changes in testosterone levels in the different groups. (F) Sperm concentration. (G) Sperm motility. (H) Sperm viability. The data are expressed as mean ± S.E.M. (n = 8), different letters represent significant differences between groups by Tukey's test (P < 0.05).

