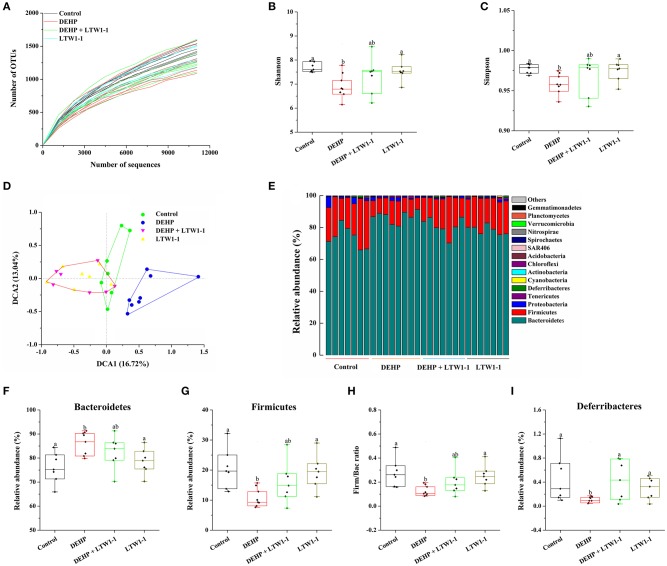
Figure 5.
Effects of L. plantarum TW1-1 treatment on the structural changes and microbial diversity of the gut microbiota in DEHP-exposed mice. (A) Rarefaction curve. (B) Bacterial diversity as assessed by the Shannon index. (C) Bacterial diversity as assessed by the Simpson index. (D) DCA of fecal microbiota in the four groups. (E) Relative abundance of each fecal microbial profile at the phylum level in the four groups. (F,G,I) Relative abundances of significantly changed bacterial phyla (Bacteroidetes, Firmicutes, and Deferribacteres). (H) The Firm/Bac ratio in the different groups. The data are expressed as mean ± S.E.M. (n = 7–8), different letters represent significant differences between groups by Tukey's test (P < 0.05).

