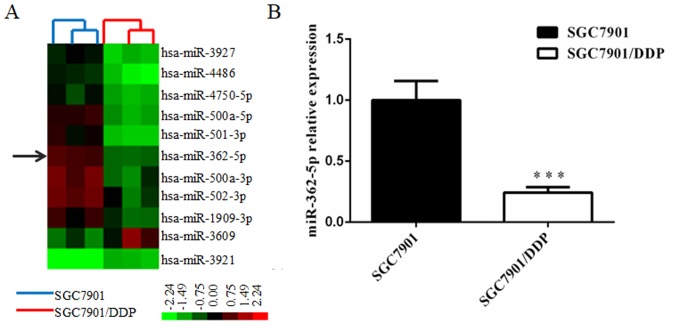
Figure 1.
miR-362-5p expression in cisplatin-resistant SGC7901/DDP cells is lower compared with cisplatin-sensitive SGC7901 cells. (A) Microarray assay of miRNA expression levels in gastric cancer cells. Hierarchical clustering of miRNA expression levels in SGC7901/DDP cells relative to SGC7901 cells. Red represents high relative expression; green represents low relative expression. Upregulated and downregulated miRNAs were defined by P<0.05 and >2-fold difference in expression relative to the control cells. The arrow indicates miR-362-5p. (B) Reverse transcription-quantitative PCR analysis demonstrated that miR-362-5p was significantly downregulated in the SGC7901/DDP cells compared with SGC7901 cells. n=3; ***P<0.001 vs. SGC7901; miRNA, microRNA; miR-362-5p, microRNA-362-5p.

