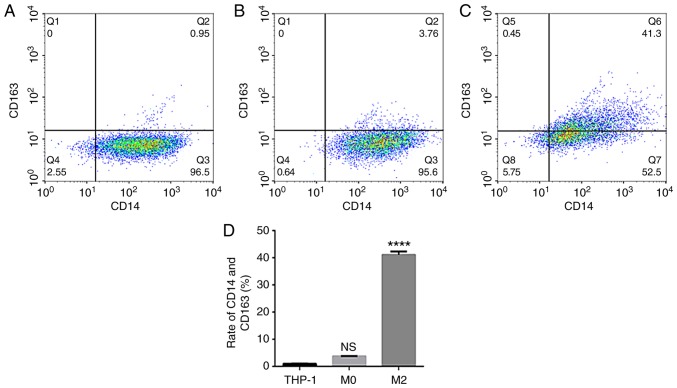
Figure 3.
Identification of TAMs by flow cytometry. The expression of CD14 and CD163 in (A) THP-1 cells, (B) M0 macrophages and (C) TAMs was examined. (D) Quantification of the flow cytometry data. ****P<0.0001 vs. control. TAMs, tumor associated macrophages; CD, cluster of differentiation; NS, not significant.

