
Figure 7.
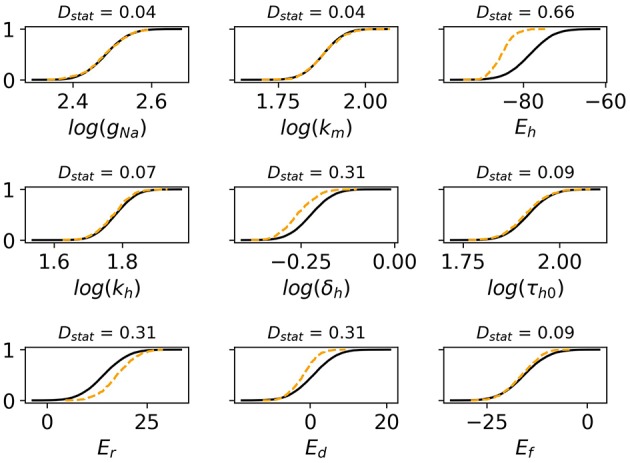
Cumulative distribution functions (CDFs) for selection of nine cell model parameters. Solid black lines are the CDFs of (pi|AP exhibits spike) and dashed orange lines are the CDFs of (pi|AP does not exhibit spike). The underlying action potentials are shown in Figures 6D,E. Non-overlapping CDFs (see e.g., Eh, δh, Er, Ed) indicates the value of the parameter statistically impacts where AP exhibits spike or not.