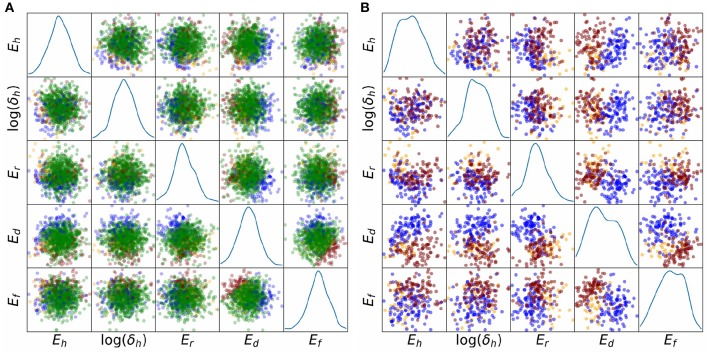
Figure 8.
Scatter plots of parameter values, colored by behavioral class, for results, representing relatively large uncertainty in all parameters. Five important parameters are plotted, Eh, δh, Er, Ed, Ef. These were identified using behavioral analysis (see text). Blue points: points in parameter space for which APs display spike but no dome; orange points: APs display dome but no spike; red points: APs are oscillatory; green points: APs are normal. (A) All points. (B) Points corresponding to non-normal APs only. The underlying APs are shown in Figures 6D,E.

