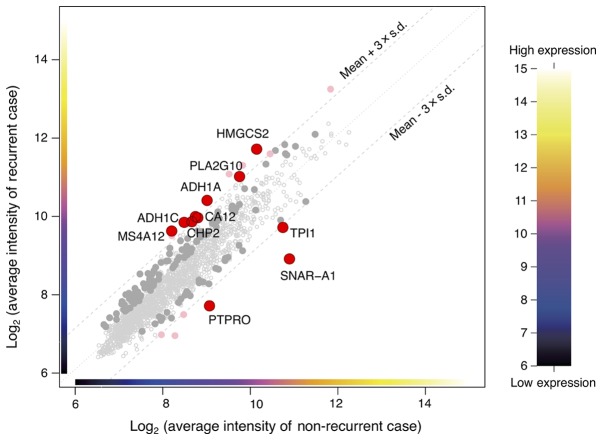
Figure 1.
Expression plot of the 1,734 genes that were selected as the genes showing the top 5% values of the coefficient of variation between the groups with and without recurrence. The red circles show the differentially expressed genes (10 genes) in the dataset by over at least threefold of the standard deviation (±) from the mean.

